
Fig. 5.
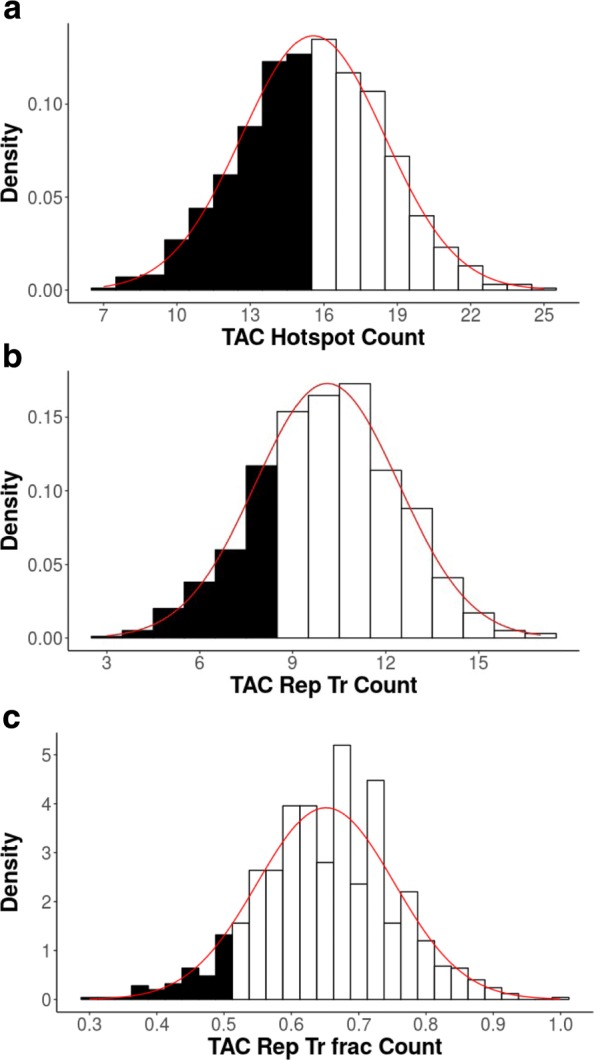
E6 Under-representation. Histograms showing the results of CDUR applied to the HPV E6 gene using the gc3 shuffle method. All subplots (a-c) and annotations are equivalent to those of Fig. 4, but for this gene. In contrast to Fig. 4 however, rather than under-representation, we see a neutral representation for TAC mutation motifs. (See Table 3 for complete results)