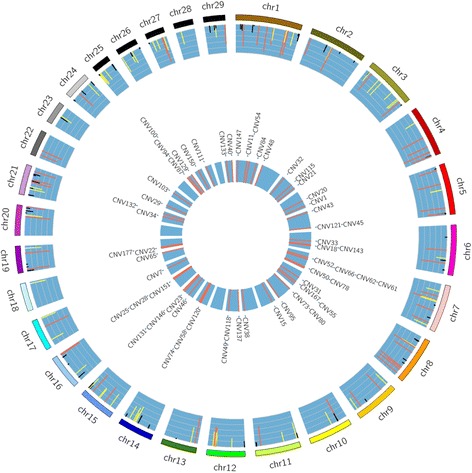
Fig. 1.

Distribution of CNV and significantly associated CNV on each Bos taurus autosome. Outer circle: distribution of 191 CNV where the height and color of histograms represent the variant frequency of each CNV (red, > 0.6; yellow, 0.3 to 0.6; and black, < 0.3); Inner circle: distribution of CNV significantly associated with at least 1 of the 10 production traits evaluated
