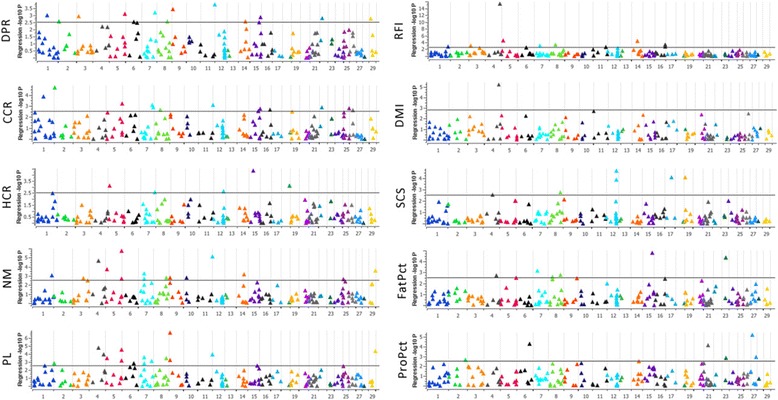
Fig. 3.

Manhattan plots of the genome-wide association study results for 10 dairy production traits of interest. Negative log10-transformed P-values from a genome-wide scan (y-axis) are plotted against genomic coordinates on 29 Bos taurus autosomal chromosomes (x-axis). The solid horizontal line in each plot represents the threshold for significance based on a P-value < 0.05 after FDR correction. DPR: daughter pregnancy rate; CCR: cow conception rate; HCR: heifer conception rate; NM: net merit; PL: productive life; RFI: residual feed intake; DMI: dry matter intake; SCS: somatic cell score; FatPct: fat percentage; and ProPct: protein percentage
