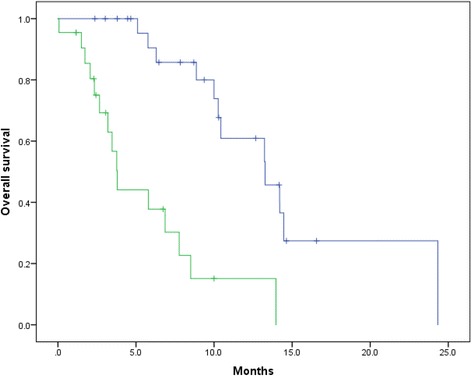
Fig. 3.

Kaplan–Meier curves of OS after initiating cabazitaxel treatment according to risk group. We stratified the patients into cohorts at low risk (0–2 risk factor, n = 26) and high risk (3–4 risk factors, n = 22). The blue and green lines indicate survival of patients at low and high risk, respectively. The median OS values of patients at low and high risk were 13.3 months and 3.8 months, respectively (p < 0.001). The incidences of the risk factors of each group are shown in Table 4
