Fig. 5.

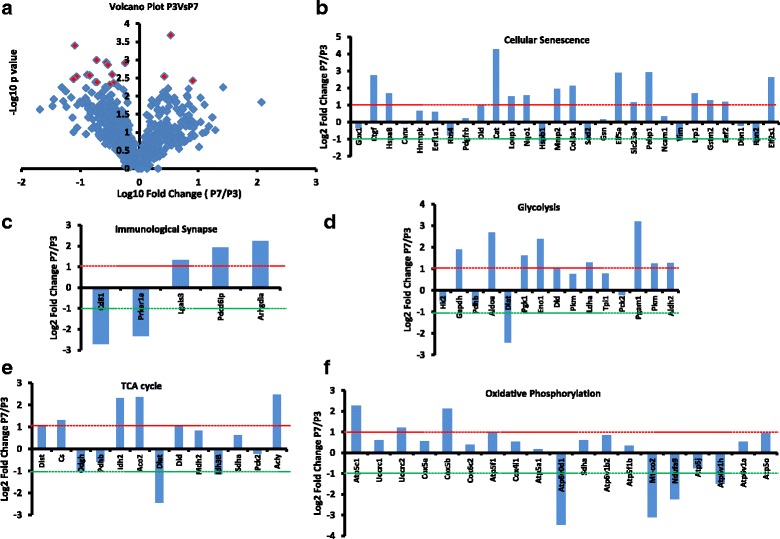
Whole-cell proteome analysis of MSCs at passages 3 and 7 was performed using the LC/MS proteomic platform to determine the changes in different proteins with the increase in passage number. a Volcano plot of all the proteins shows no significant changes in all but 18 (shown in red color) proteins (p < 0.05). b–f The values of proteins involved in different pathways including cellular senescence (b), immunological synapse (c), glycolysis (d), tricarboxylic acid (TCA) cycle (e), and oxidative phosphorylation (f). Log2 fold change ratios of protein values at P7 versus P3 were calculated. The protein values between −1 and + 1 were considered to be normal and not changing significantly. Values higher than +1 indicate significant upregulation (at P7 compared to P3) of the protein and values lower than −1 indicate significant downregulation of the protein levels (n = 3)
