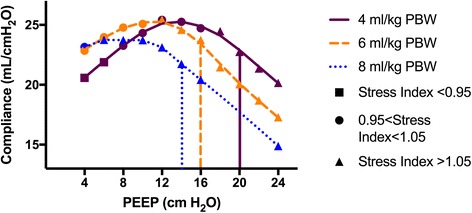
Fig. 1.

Point of maximal compliance depends on tidal volume used in PEEP trial. Plotted markers represent static compliance of respiratory system (CRS) at each PEEP level during a decremental PEEP trial for a single patient. Marker shapes correspond to measured stress index for the PEEP–tidal volume pairing, and marker color corresponds to tidal volume. Loess curve connects points with identical tidal volumes. Vertical lines indicate the PEEP selected by ART protocol for a given tidal volume. PBW predicted body weight, PEEP positive end-expiratory pressure
