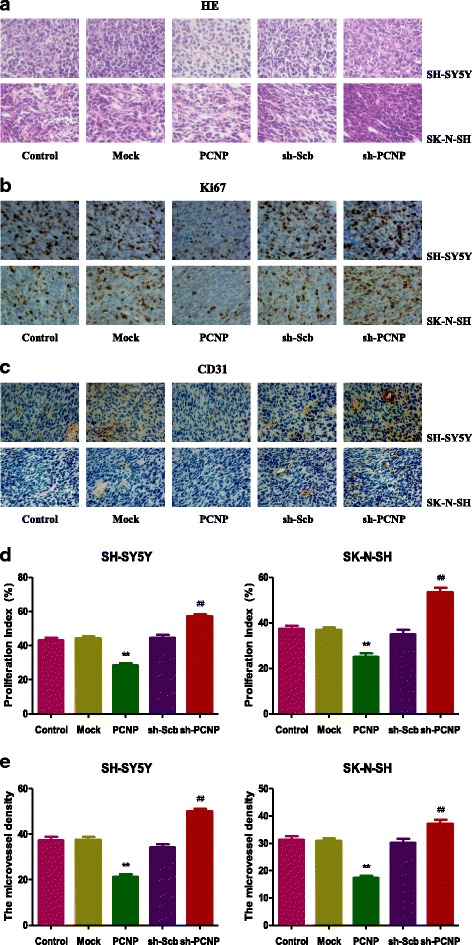
Fig. 9.

Effects of PCNP on the PI and MVD of human neuroblastoma xenografts. (a, b, c) Representive photographs of HE, Ki67, and CD31 staining in SH-SY5Y and SK-N-SH xenograft tumors; original magnification 400×. (d, e, f) The PI and MVD were calculated by the formula shown above. Values are presented as mean ± SEM (n = 6); *P < 0.05, **P < 0.01 compared with the Mock group; #P < 0.05, ##P < 0.01 compared with the sh-Scb group
