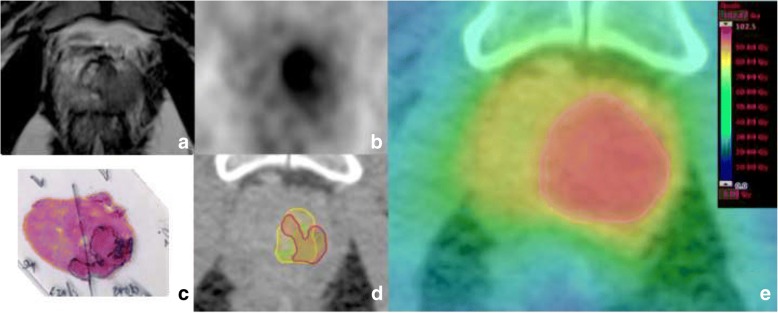
Fig. 1.
Transverse T2-weighted image (a) shows a hypointense signal in the left lobe. (b) shows a PSMA PET image with intense focal uptake located in the left lobe. Haematoxylin and eosin gross section histopathology shows a large tumour focus in the left lobe (c). (d) shows a transverse CT image (from PSMA PET/CT scan) with projected GTVs (green: GTV-histo, yellow: GTV-PET, red: GTV-MRI) for patient 9. In (e) the colourwash representation for Plan95union is presented. The PTV of the boost volume is marked in red

