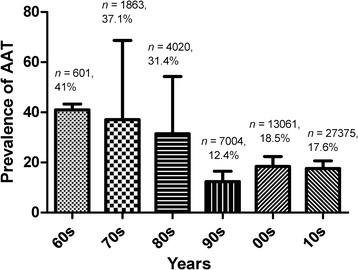
Fig. 3.

The prevalence of AAT in Nigeria over six decades. Tukey multiple pairwise comparison test of the analysis of variance shows no significant difference (F(5, 68) = 1.616, P = 0.1676, r2 = 10.6%) in the prevalence reports across decades. Proportions of each study conducted (74 studies) and total number of animal screened is shown in the graph
