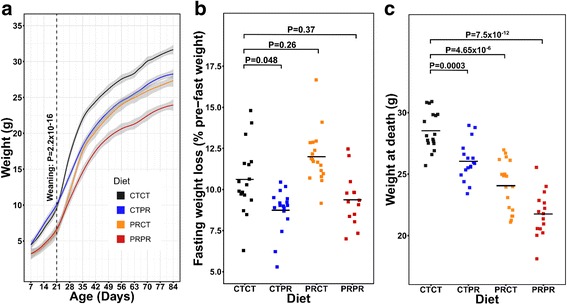
Fig. 2.

A C57BL/6 J protein restriction mouse model that replicates phenotypes seen previously. a Weight progression of male offspring between 7 and 84 days of age. Grey shading = 95% confidence interval. Dotted line = time of weaning. Weaning weights of male offspring exposed to PR diet (n = 33, nLitters = 10) were 34% lower than those exposed to CT diet (n = 34, nLitters = 11). P = 2 × 10− 16, Welch’s t test using litter means. b Fasting weight loss during 16 h fast as a proportion of pre-fast weight was lower in CTPR (mean = 8.87%, n = 17, nLitters = 11) than CTCT (mean = 10.6%, n = 17, nLitters = 10) (P = 0.048) and the same in PRCT (mean = 11.99%, n = 18, nLitters = 9) and PRPR (mean = 9.37%, n = 15, nLitters = 10) as CTCT (P = 0.26 and P = 0.37). A linear model was run for each phenotype against diet and sibling relatedness was accounted for using robust standard errors. P values were adjusted for n = 3 tests using Bonferroni’s method. c Weight at death was distinct between the four diet groups. CTPR mice were significantly lighter (mean = 26.05 g) than CTCT mice (mean = 28.53 g) at death (P = 0.0003). PRCT mice were lighter than CTCT mice (mean = 24.06 g, P = 4.65 × 10− 6) and PRPR mice were the lightest (mean = 21.76 g, P = 7.5 × 10− 12). A linear model was run for each phenotype against diet and sibling relatedness was accounted for using robust standard errors. P values were adjusted for n = 3 tests using Bonferroni’s method
