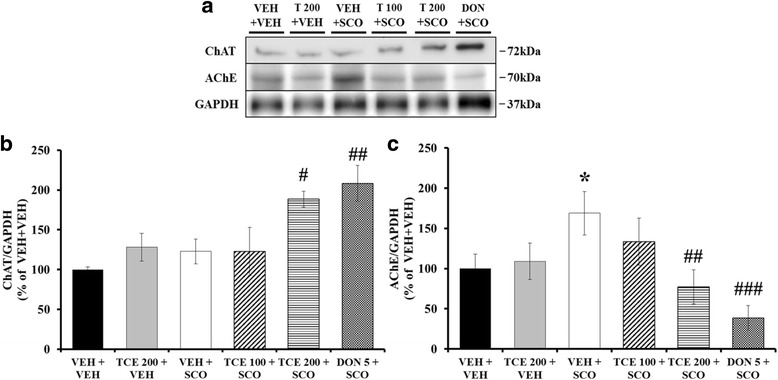
Fig. 4.

Effect of TCE on hippocampal ChAT and AChE expression in the scopolamine-induced model. a Representative protein bands of ChAT and AChE. GAPDH was used as a loading control. b The quantification of ChAT expression is shown (n = 5 per group). c The quantification of AChE expression is shown (n = 5 per group). Bar graph is expressed as a percentage of VEH + VEH control. The data are expressed as the means ± S.E.M. *p < 0.05 compared with VEH + VEH; #p < 0.05, ##p < 0.01, ###p < 0.001 compared with VEH + SCO. VEH; vehicle, SCO; scopolamine, T; TCE, DON; donepezil
