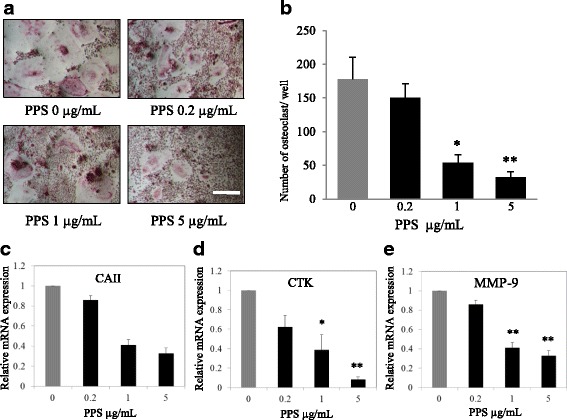
Fig. 1.

Shows inhibitory effect of NaPPS on canine OC differentiation. a The cells were treated with various concentration of NaPPS followed by M-CSF (20 ng/mL) and RANKL (50 ng/mL) for 7 days. The cells were stained for TRAP stain and b TRAP-positive cells (≥3 nuclei) were counted. Scale bar- 100 μm. Bar graphs show the concentration effects of NaPPS on mRNA expression levels of c CA II, d CTK and e MMP-9 determined by real-time PCR and results were normalized to the expression of GAPDH. Data are representative of five independent experiments and expressed as means ± SE. Means with *are significantly different from 0 μg/mL of NaPPS (*p < 0.05, **p < 0.01)
