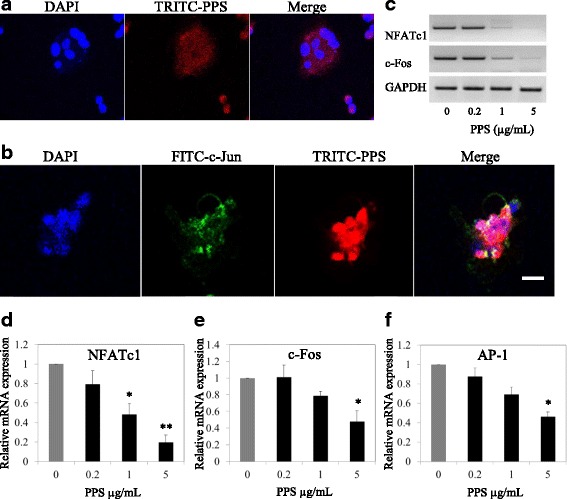
Fig. 3.

Inhibitory and co-localization patterns of NaPPS with actively transcribed genes. Osteoclast differentiated from canine bone marrow with supplement of M-CSF (25 ng/mL) RANKL (50 ng/mL) together with absence and presence of NaPPS (0.2, 1, 5 μg/mL) for 7 days was done. a Confocal microscopic images of invasion of TRITC-labeled NaPPS in to osteoclast and b localization with c-Jun (subunit of AP-1 transcription complex) are shown. The orange in the overlay image indicates that NaPPS and gene activation proteins c-Jun (green) are in the same location. Nuclei were stained with 4,6-diamidino-2-phenylindole dye (DAPI). Scale bar- 100 μm. c Attenuation effect of NaPPS on master regulators of osteoclastogenesis (NFATc1, c-Fos) by dose dependent pattern are shown. d, e and f Relative mRNA expression of NFATc1, c-Fos and AP-1 according to the NaPPS concentration gradient was significantly attenuated at 5 μg/mL. Data expressed as mean ± SE for each PPS concentration after normalizing for the expression of the GAPDH. Means with *are significantly different from 0 μg/mL of NaPPS (*p < 0.05, **p < 0.01)
