Fig. 2.

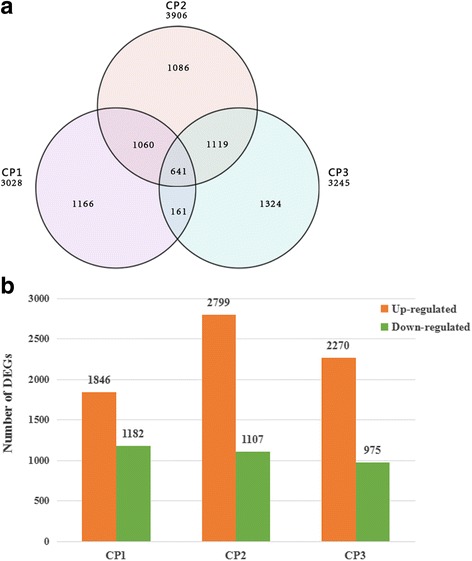
Venn diagram and histogram of DEGs during low temperature stresses. a Venn diagram showing DEGs expressed at each of the three low temperature treatments. b The numbers of DEGs identified in comparisons between pairs of libraries

Venn diagram and histogram of DEGs during low temperature stresses. a Venn diagram showing DEGs expressed at each of the three low temperature treatments. b The numbers of DEGs identified in comparisons between pairs of libraries