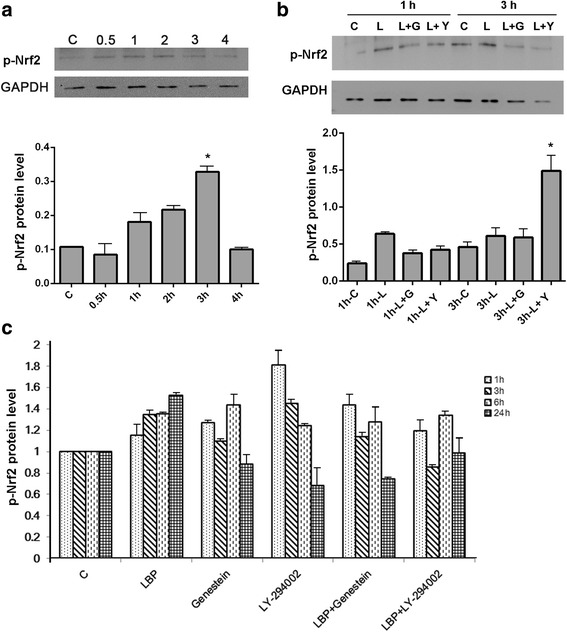
Fig. 2.

Response of p-Nrf2 to treatment with LBP and inhibitors. a – The protein level of p-Nrf2 in HSF cells treated with LBP for 0 (control, C), 0.5, 1, 2, 3 or 4 h. b – The protein level of p-Nrf2 in HSF cells in medium (1 h-C, 3 h-C, control) or treated with LBP alone for 1 h or 3 h (1 h-L, 3 h-L), LBP plus genistein for 1 h or 3 h (1 h-L + G, 3 h-L + G), or LBP plus LY294002 for 1 h or 3 h (1 h-L + Y, 3 h-L + Y). The protein level of p-Nrf2 was determined via western blotting. c – The nuclear level of p-Nrf2 determined using the ARE reporter for 1, 3, 6 or 24 h, as shown.. Experiments were repeated at least in triplicate, *p < 0.05
