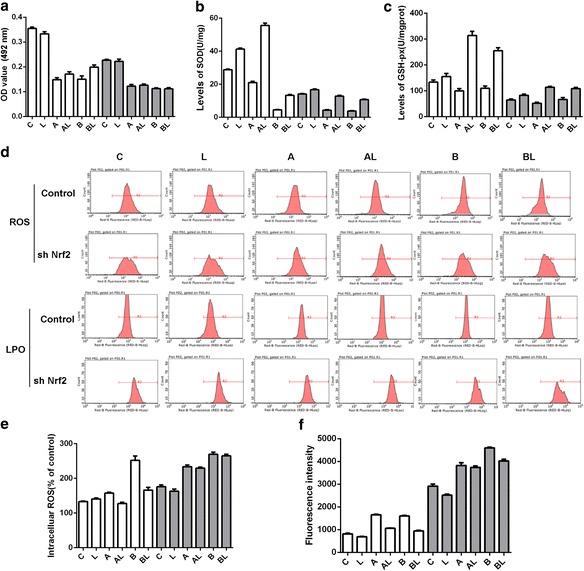
Fig. 4.

Levels of important physiological factors and cell viability in response to UV radiation. a – Cell viability determined using the MTT assay. b – The levels of SOD. c – The levels of GSH-PX. D and e – The levels of ROS. d and f – The levels of lipid peroxide. Experiments were repeated at least in triplicate. For all: White plots refer to cells without Nrf2 silencing; grey plots refer to cells with NRF2 silencing. c – control group; a – UV at a dose of 25 J/cm2; b – UV at a dose of 300 mJ/cm2; L – LBP; AL – LBP with UV at a dose of 25 J/cm2; BL – LBP with UV at a dose of 300 mJ/cm2
