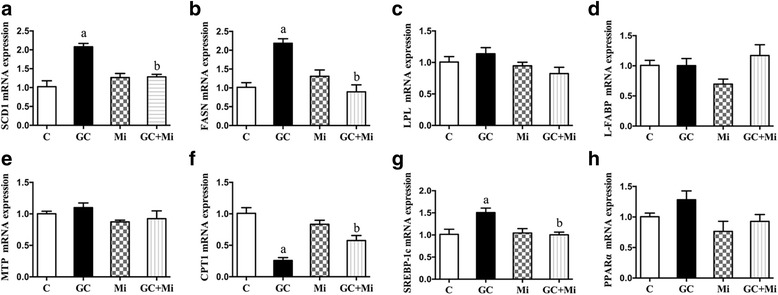
Fig. 6.

mRNA expression of SCD1 (a), FASN (b), LPL (c), L-FABP (d), MTP (e), CPT1 (f), SREBP-1c (g) and PPARα (h) in GC or Mi or GC + Mi treatment. Data are expressed as the mean ± SEM. Effects of different treatments were analyzed by two-sided Student’s t-test. ap < 0.05 vs. control, bp < 0.05 vs. GC. n = 3 in each treatment
