Fig. 3.
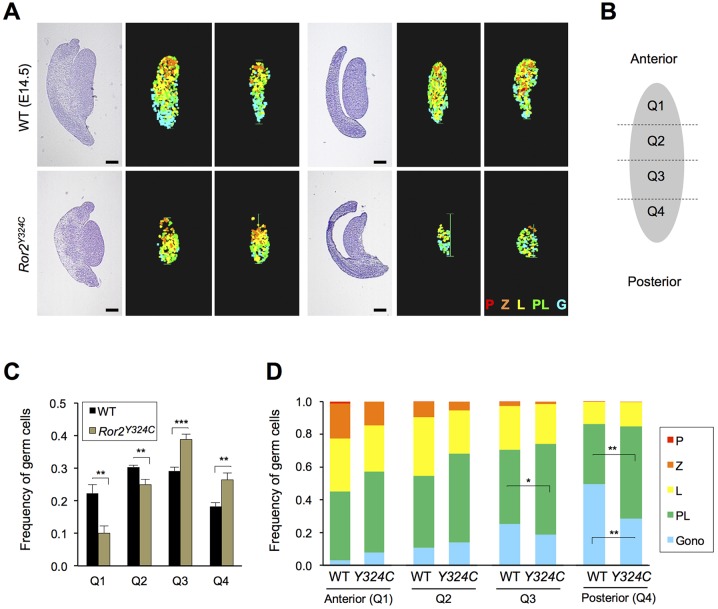
Aberrant distribution of germ cells in the ovary causes meiotic entry defect. (A) Histologic sections with H&E stain at left and heat maps indicating meiotic progression on right. (B) Diagram showing division of ovaries into quadrants. (C) Relative frequency of germ cells counted in each quadrant in WT versus Ror2Y324C/Y324C, n=6 embryos. Data represented as mean±s.e.m. (D) Distribution of germ cells scored in each stage of meiotic prophase for each quadrant, n=6 WT and n=6 Ror2Y324C/Y324C ovaries. Gono, gonocytes; PL, preleptotene stage; L, leptotene stage; Z, zygotene stage; P, pachytene stage. ***P<0.001, **P<0.01, *P<0.05 by t-test. Scale bars: 200 µm.

