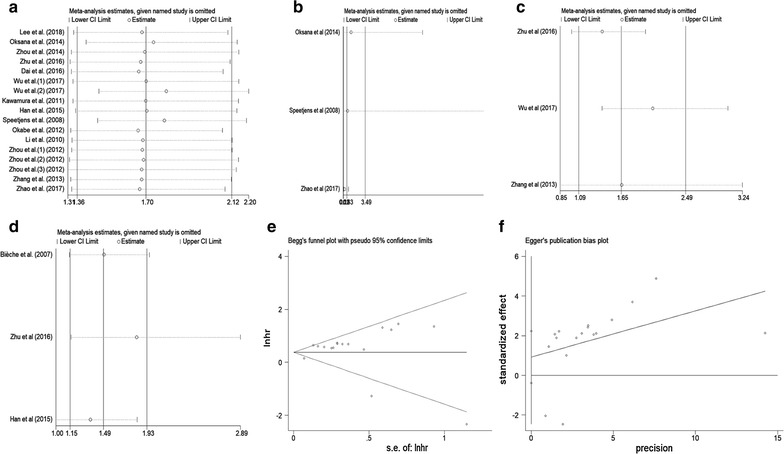
Fig. 6.

Sensitivity analysis plot of pooled HRs of OS (a), DFS (b), PFS (c) and RFS (d) for cancer patients with abnormally expressed CXCL5. Begg’s test (e) and Egger’s test (f) for publication bias

Sensitivity analysis plot of pooled HRs of OS (a), DFS (b), PFS (c) and RFS (d) for cancer patients with abnormally expressed CXCL5. Begg’s test (e) and Egger’s test (f) for publication bias