
Fig. 4.
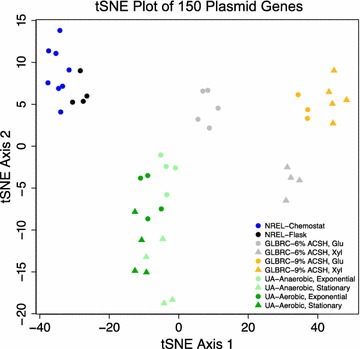
t-SNE analysis of the plasmid-restricted expression data from the 3 laboratories. Blue, NREL, fermentor with biomass hydrolysates; black, NREL, flasks with rich RMG medium; light gray, GLBRC, 6% ACSH; Orange, GLBRC, 9% ACSH; light green, Univ. Athens (UA), anaerobic; dark green, UA, aerobic. Circles, exponential growth stage (exponential in UA dataset and Glucose stage, Glu, in GLBRC dataset); triangles, later growth stage (stationary stage in UA dataset and xylose stage, Xyl, in GLBRC dataset)