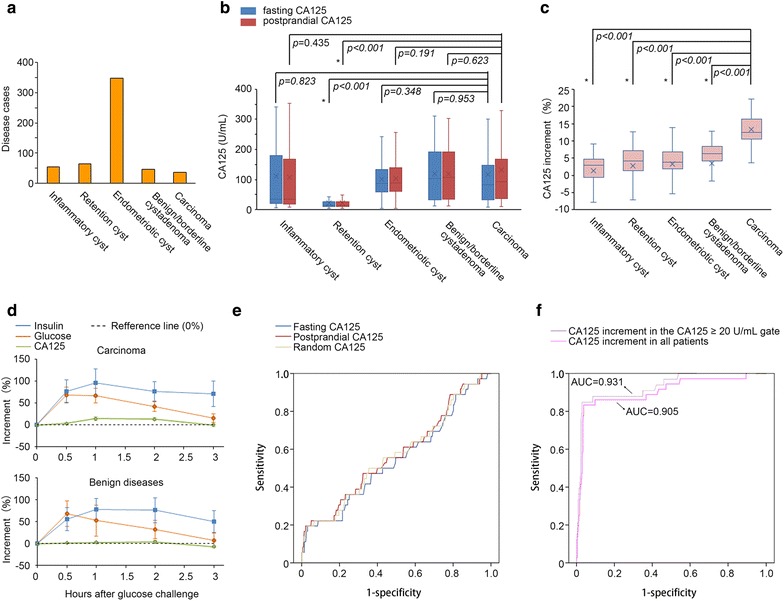
Fig. 1.

The clinical, metabolic and diagnostic characteristics of increases in postprandial serum CA125. a Disease distribution characteristics of the enrolled patients. b Boxplots for the fasting and postprandial CA125 levels of the five disease groups. c Boxplots for the postprandial CA125 increases of the five disease groups. d Metabolic characteristics of blood glucose, serum insulin and CA125 in the cancer and non-cancer patients. e ROC curves of random, fasting and postprandial CA125 in the study population. f ROC curves of the CA125 increment in the CA125 ≥ 20 U/mL gate and in all patients of the study population (i.e., CA125 ≥ 0 U/mL gate). *Statistical significance (two-sided Student’s t test)
