Fig. 3.

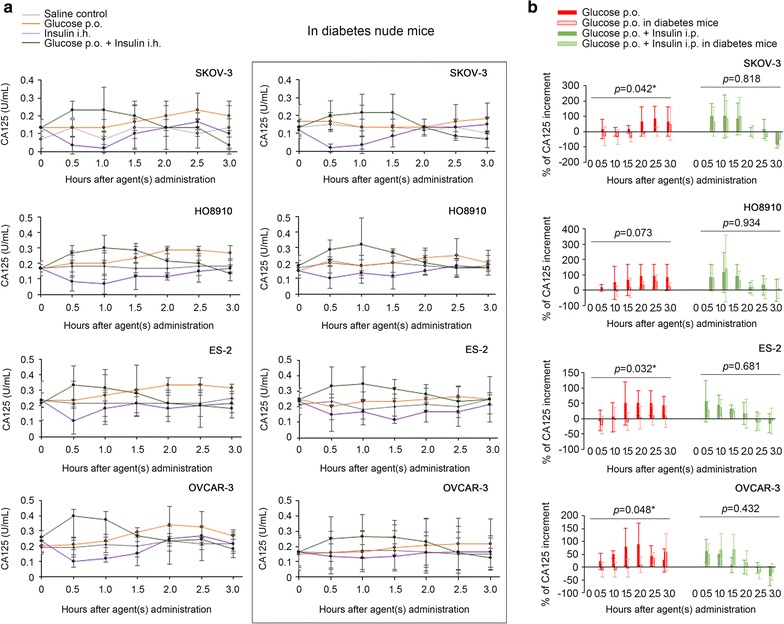
Postprandial serum CA125 fluctuations mimicked in animal models. a Shown are the time-dependent serum CA125 fluctuations after administration of saline, glucose, insulin or glucose plus insulin in SKOV-3, HO8910, ES-2 and OVCAR-3 xenograft nude mouse models. b Comparison of the percentages of serum CA125 increase after administration of glucose or glucose plus insulin among nude mouse models and diabetes nude mouse models. The oral glucose-induced increments in serum CA125 were significantly lower in the diabetes animal models than in the non-diabetes animal models. *Statistical significance (ANOVA)
