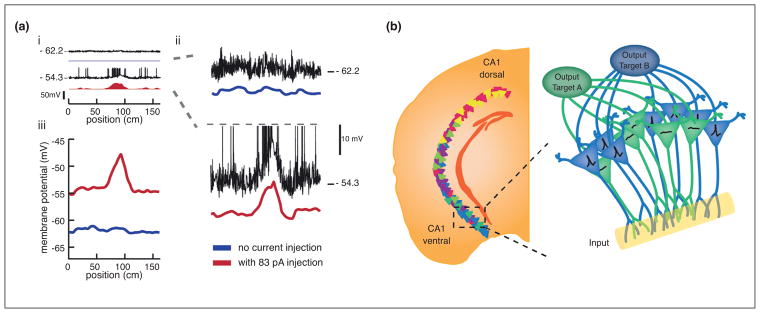
Figure 3.
Heterogeneity in biophysical properties, genetic expression profiles and connectivity interact to shape place responses. (a) ‘Silent’ pyramidal neurons can be converted into place cells by injection of uniform depolarizing current, highlighting a potential role for intrinsic biophysics in gating place responses. (ai) Whole-cell recordings were made from CA1 pyramidal neurons as a rat traversed an oval-shaped track [64]. Linearized position is shown. Top: the membrane potential (black) and firing rate (blue) of silent CA1 pyramidal neuron before injection of positive current. Bottom: the membrane potential (black) and firing rate (red) of the same neuron during injection of positive current. (aii) Closer view of the membrane potential (black) and mean subthreshold membrane potential (color). Spikes have been truncated (gray dashed line). Note the emergence of a hill-shaped ramp in the subthreshold membrane potential during injection of positive current. (aiii) The average membrane potential for all laps before (blue) and during (red) current injection. Note that the membrane potential is relatively flat on laps prior to the current injection, with no indication of where the field will emerge upon depolarization. Figure modified with permission from [64]. (b) Schematic showing the possible interaction between several sources of place cell heterogeneity. Left: Cartoon illustrating genetic variation across the longitudinal axis. The colors of the cells represent pole-specific marker genes in dorsal (warm colors) or ventral (cold colors) CA1. Figure modified with permission from [74]. Inset: within the ventral CA1 pole, pyramidal neurons with similar output projections share similar gene expression patterns. Cartoon depicts a hypothetical scenario in which two different subpopulations are excited to differing degrees upon receiving a shared input. Differences in the genetic profiles of these subpopulations lead to differential expression of ion channels and receptors that renders one subpopulation (blue) more sensitive to the particular input than another subpopulation (green).

