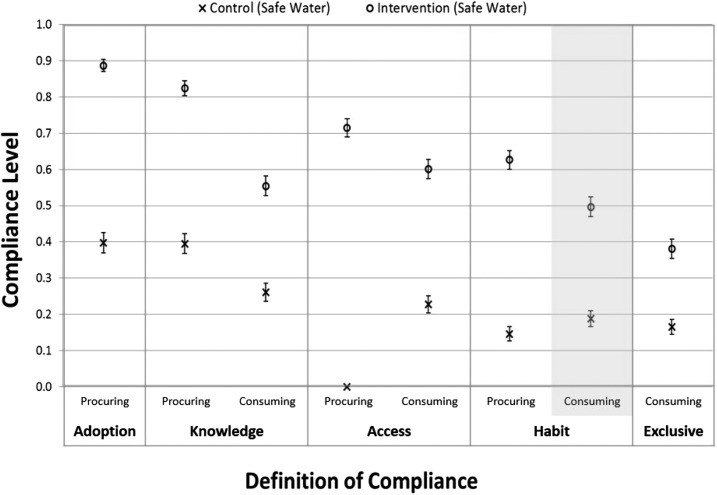
Figure 3.
Compliance levels for each component of Safe Drinking Water Compliance Framework for consumers of purchased garrafones during control periods (N = 1,255 household observations) and consumers of ultraviolet-treated or purchased garrafones during intervention periods (N = 1,346 household observations). Basic and Enhanced program data are combined over the entire 18-month time period, leading to multiple observations per household. Estimates of standard errors account for clustering. The primary outcome results (Habit of consuming safe water) are shaded for emphasis.

