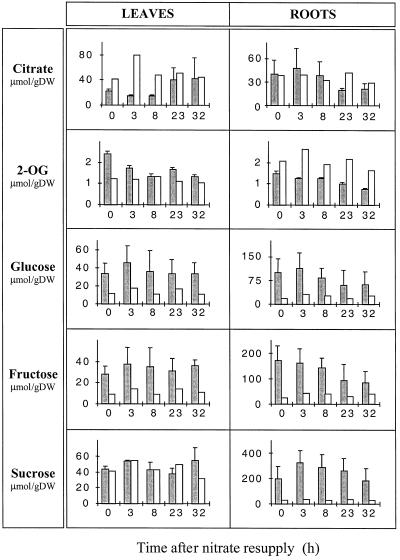
Figure 6.
The effect of nitrate addition on the pool of organic acids (citrate and 2-OG) and sugars (Glc, Fru, and Suc) in deveined leaves and roots. N-starved/nitrate-resupplied plants are shown by the shaded histograms; control nitrate-fed plants are depicted by the nonshaded histograms. Values are the means of two independent experiments for nitrate supply experiments, whereas the controls are single experiments. Data from each individual experiment are the averages of material taken from four independent plants. DW, Dry weight.

