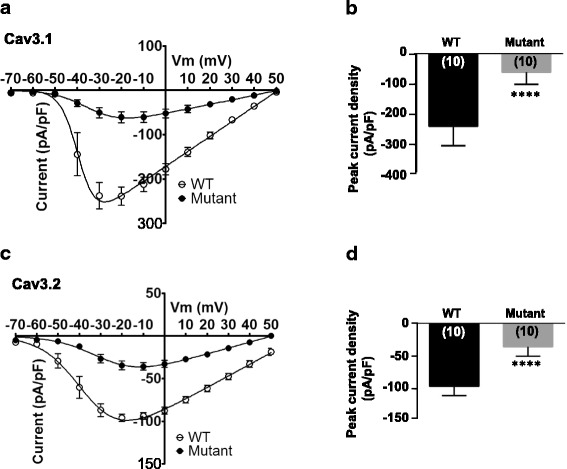
Fig. 4.

Calcium currents evoked by wild type and mutant Cav3.1 and Cav3.2 channels in tsA-201 cells. (a) Current-voltage (I/V) relationship of wild type or mutant Cav3.1-GFP ∆CT (1851–1875) mutant channels (n = 10). Values are represented as means +/− S.E. The solid lines are fits with the Boltzmann equation. (b) Mean peak current density representation from wild type or mutant Cav3.1-GFP ∆CT (1851–1875) channels (P < 0.001, n = 10). Asterisks denote statistical significance relative to wild type (****P < 0.0001, Student’s t-test). (c) Current-voltage (I/V) relationship of wild type or mutant Cav3.2-GFP ∆CT (1860–1884) channels (n = 18–19). Values are represented as means +/− S.E. The solid lines are fits with the Boltzmann equation. (d) Mean peak current density representation from wild type or mutant Cav3.2-GFP ∆CT (1860–1884) channels (P < 0.001, n = 10). Asterisks denote statistical significance relative to wild type (****P < 0.0001, Student’s t-test)
