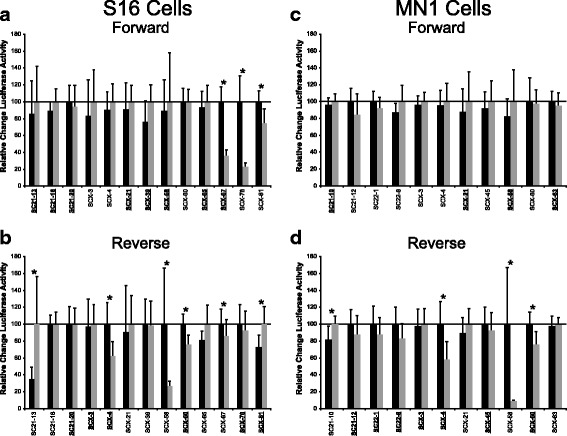
Fig. 3.

Eight genomic regions display allele-specific differences in regulatory activity in Schwann cells and motor neurons. a and b The activity of the major (black bars) and minor (grey bars) alleles of the 13 regions active in Schwann cells (Fig. 2) were evaluated in the forward (a) or reverse (b) orientation. c and d The major and minor alleles of the 11 genomic segments active in MN1 cells were compared as in panels a and b. In all panels, the allele with higher luciferase activity was set to “100”, error bars represent standard deviations, bold and underlined text indicate the orientation(s) that were active in the experiments shown in Fig. 2, and asterisks indicate a significant change in activity (p ≤ 0.05)
