Fig. 5.
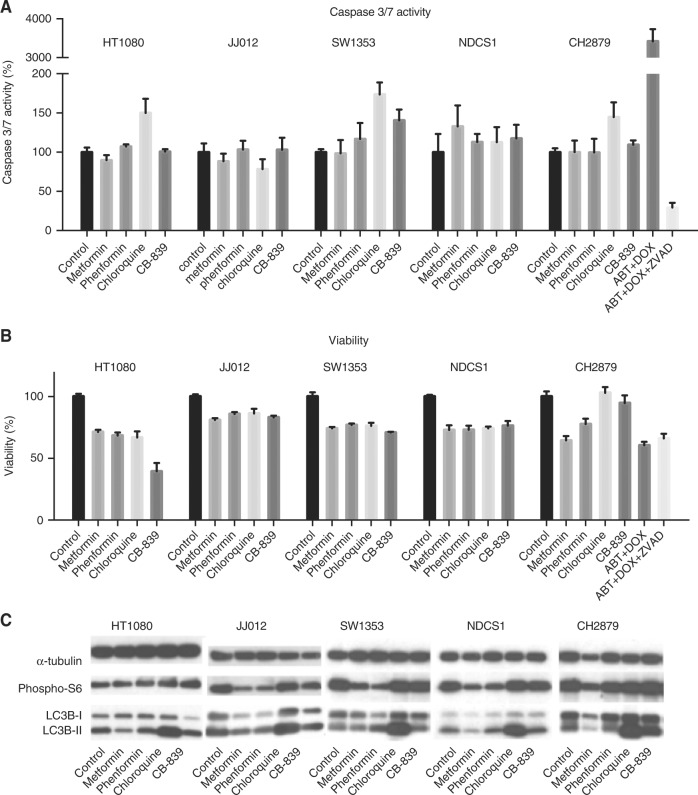
The different compounds provoke different intracellular responses. a Caspase 3/7 activity of HT1080, JJ012, SW1353, NDCS1 and CH2879 cells after 24 h treatment with the metformin, phenformin, chloroquine and CB-839, as determined by caspase-glo 7/3 assays. Only chloroquine slightly increases Caspase 3/7 activity in 3/5 cell lines. CH2879 cells treated with ABT-737 and doxorubicin were used as positive control. For the negative control these compounds were combined with Z-vad-FMK. b Simultaneously to the measurement of caspase 3/7 activity, cell viability was measured using a Presto-Blue assay. c Western blot to evaluate the effect of metformin, phenformin, chloroquine and CB-839 on phosphorylated S6 and LC3B levels in five chondrosarcoma cell lines. Cell lines were treated for 72 h with their corresponding IC50 values. Metformin and phenformin decreased levels of phosphorylated S6 in 4/5 and 3/5 cell lines, respectively, and decreased levels of LC3B in 4/5 and 1/5 cell lines, respectively. Chloroquine increased LC3B in all cell lines

