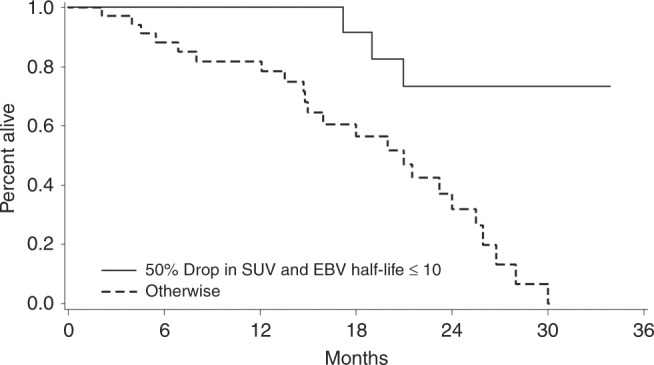
Fig. 1.

Overall survival (OS) curves of responders (top curve, > 50% drop in sum of SUVmax of target lesions and plasma EBV DNA clearance of ≤ 10 days, 1-year OS 100%) versus non-responders (bottom curve, ≤ 50% drop in sum of SUVmax and plasma EBV DNA clearance of > 10 days, 1-year OS 81.9%) based on the dual endpoint (log-rank, p = 0.0003). For the evaluable cohort (n = 58), the number of death and progression are 30 and 35
