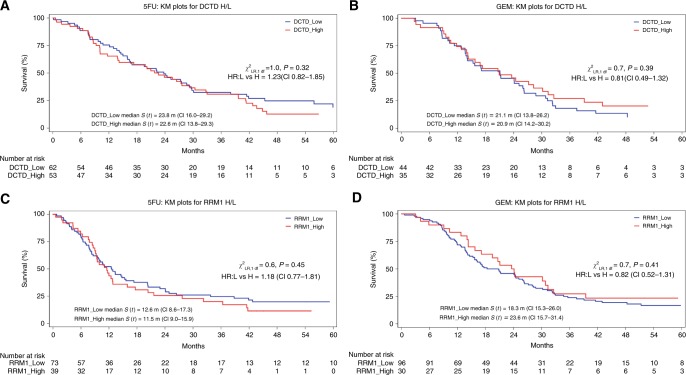
Fig. 2.
Kaplan–Meier survival curves of patient strata dichotomised on DCTD (a, b) and RRM1 (c, d) expression status (negative/weak = 0/1, moderate/strong = 2/3). 5-FU patients treated with 5-fluorouracil and folinic acid, GEM patients treated with gemcitabine, y axis proportion of patients being alive, xaxis weeks from randomisation. p values for log-rank χ2 analyses are given in the respective graph

