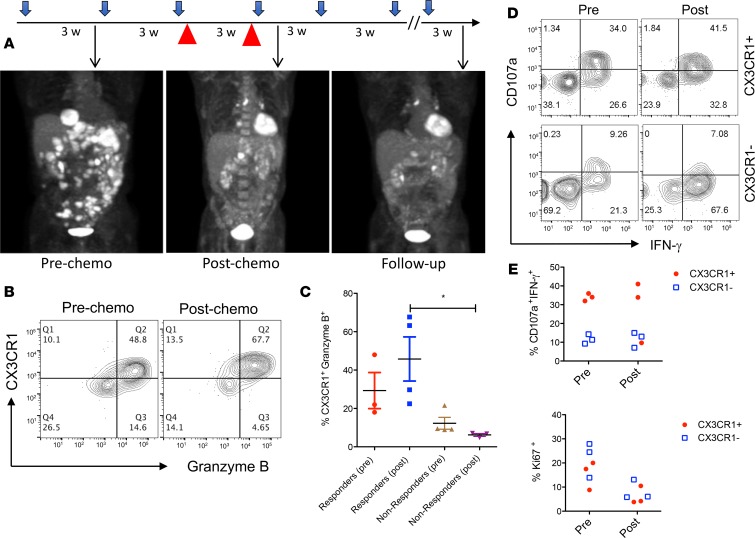
Figure 2. Patient responses to chemoimmunotherapy with an increase of CX3CR1+Granzyme B+CD8+ T cells.
(A) Treatment schedule and clinical responses of a patient with metastatic melanoma who received pembrolizumab single-agent and chemotherapy paclitaxel and carboplatin (red arrow head) that were initiated at 175 mg/m2, and an AUC (area under curve) of 5 every 3 weeks for 2 cycles in combination with pembrolizumab. PET/CT scan results were collected at each time point (arrows) to demonstrate the disease status. Patient received a total of 12 cycles of pembrolizumab at the end of follow up, shown here. (B) Following the same schedule of treatment as in A, blood samples were collected for flow analysis of CX3CR1+Granzyme B+ among CD11ahiCD8+ T cells. (C) The frequency of CX3CR1+Granzyme B+ among CD11ahiCD8+ T cells in responders (n = 3 pre, 4 post) and nonresponders (n = 4) before and after chemotherapy as treated in A. *P < 0.05 compared between responders and nonresponders to CIT (1-way ANOVA, P = 0.024). (D) Representative flow cytometry data showing the CTL function of CX3CR1+ or CX3CR1– CD8+ T cells from one of the chemoimmunotherapy responders (n = 3) after a brief ex vivo stimulation of T cells with PMA and ionomycin. (D and E) CTL function (CD107a expression and IFN-γ production) and proliferation (Ki67 expression) of CX3CR1+ or CX3CR1– CD8+ T cells in responders (n = 3) prior to and after PD-1 therapy.

