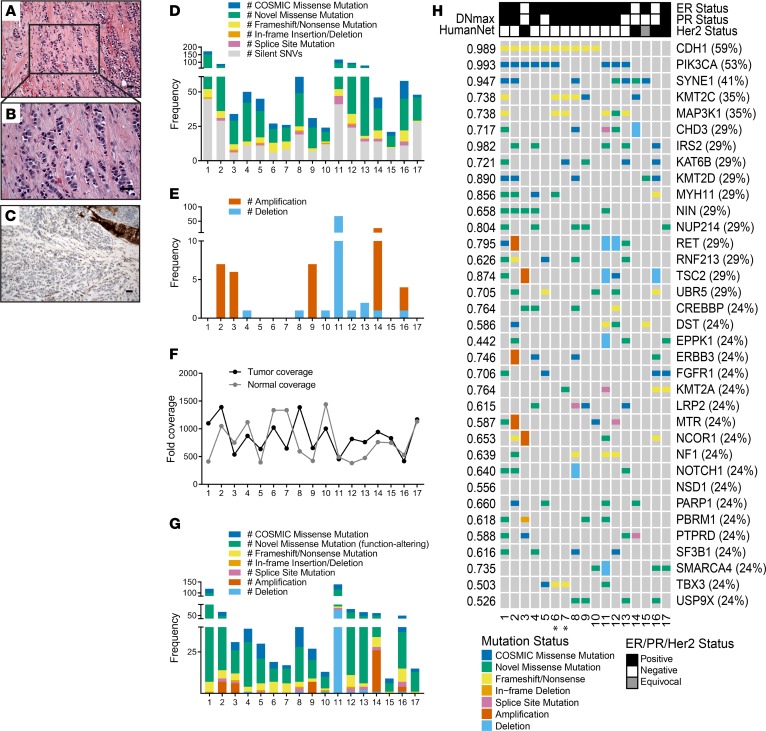
Figure 1. Molecular profile of pleomorphic invasive lobular carcinoma.
(A and B) Representative images of H&E-stained pleomorphic invasive lobular carcinoma (PILC). (C) Representative image of E-cadherin staining in PILC. (D) Total mutation events across the PILC tumors (n = 17). (E) Distribution of copy number variant types (log2 ratio ≥1 or ≤–1) across the PILC tumors. (F) Mean coverage of sequenced PILC tumors and their matched normal controls. (G) Filtered functional somatic alteration events identified in the PILC tumors. (H) Oncoprint heatmaps of recurrently altered genes in PILC. MUtations For Functional Impact on Network Neighbors (MUFFINN) prediction scores are shown on left. Asterisk indicate samples from the same patient. Scale bar: 20 μm.

