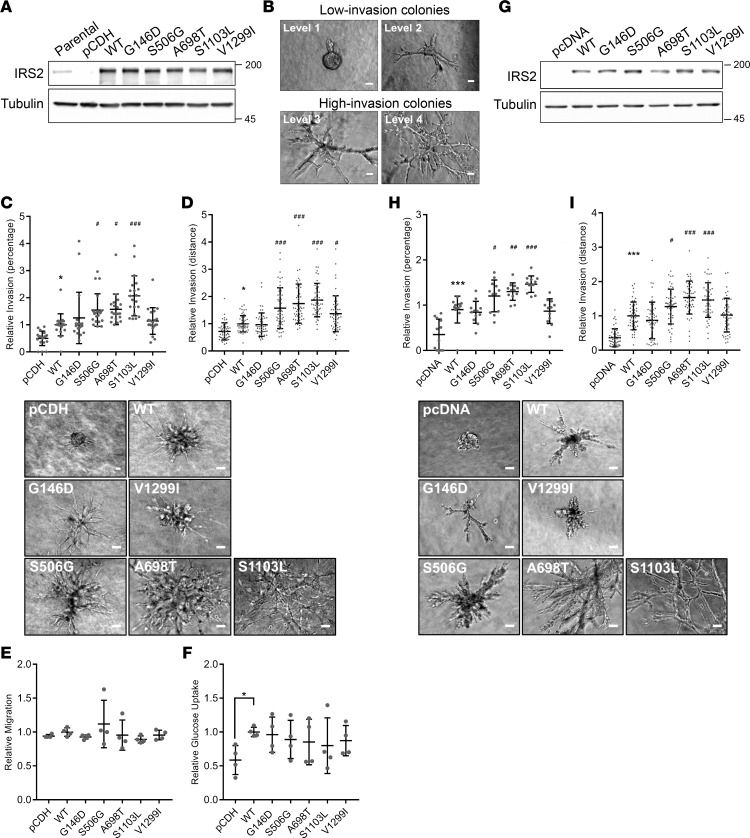
Figure 4. IRS2 mutations linked to invasion.
(A) Immunoblots of cell extracts from SUM-159 parental cells and SUM-159:IRS1–/–,IRS2–/– cells stably expressing empty vector (pCDH), wild-type (WT) human insulin receptor substrate 2 (IRS2), or the IRS2 mutants identified in pleomorphic invasive lobular carcinoma (PILC). (B) Representative images used to score invasive colonies grown in Matrigel/collagen I gels. Cells grown in a Matrigel/collagen I gel were scored for (C) the extent of invasion (mean ± SD, n = 20 wells from 5 independent experiments) or (D) the distance of invasive branching (mean ± SD, n = 50 colonies from 1 of 3 representative experiments). Representative images for each cell line are shown. (E) Cell migration assay using Transwell culture chambers (mean ± SD of 4 independent experiments). (F) Glucose uptake assay (mean ± SD of 4 independent experiments). (G) Immunoblots of cell extracts from PyMT:Irs1–/–,Irs2–/– cells stably expressing empty vector (pcDNA), wild-type human IRS2 (WT), or the IRS2 mutants identified in PILC. Cells grown in a Matrigel/collagen I gel were scored for (H) the extent of invasion (mean ± SD, n = 12 wells from 5 independent experiments) or (I) the distance of invasive branching (mean ± SD, n = 50 colonies from 1 of 3 representative experiments). Representative images for each cell line are shown. Student’s t test was performed between vector (pCDH or pcDNA) and WT-IRS2, and 1-way ANOVA with Bonferroni post hoc testing was performed between WT-IRS2 and IRS2 mutants. *P < 0.05, relative to pCDH; ***P < 0.001, relative to pcDNA; #P < 0.05, ##P < 0.01, ###P < 0.001, relative to WT-IRS2. Scale bar: 20 μm.

