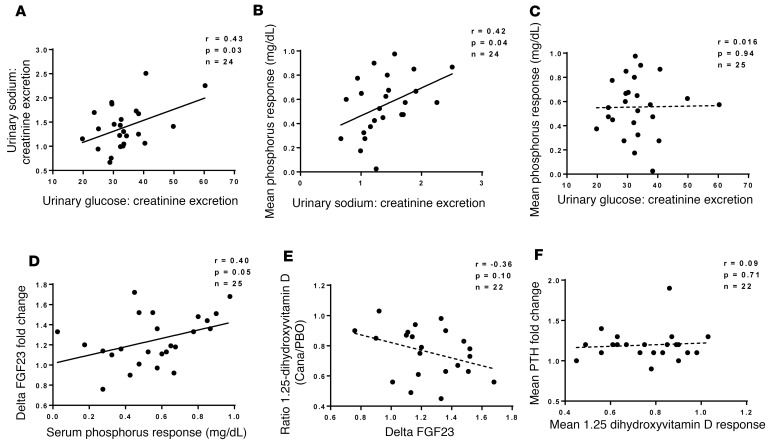
Figure 6. Associations among pharmacodynamic changes in response to canagliflozin.
Scatterplots showing the relationships between urinary excretion of sodium versus urinary glucose excretion (A), mean serum phosphorus response versus urinary sodium excretion (B), mean serum phosphorus response versus urinary glucose excretion (C), ΔFGF23 versus mean serum phosphorus response (D), mean 1,25-dihydroxyvitamind D versus ΔFGF23 (E), and mean PTH response versus mean 1,25-dihydroxyvitamin D response. Dotted lines represent correlations with P > 0.05. In each case, the indices of drug-induced changes are defined in Figure 3’s legend. The analysis excludes patients with missing data, as explained in Figure 3’s legend.

