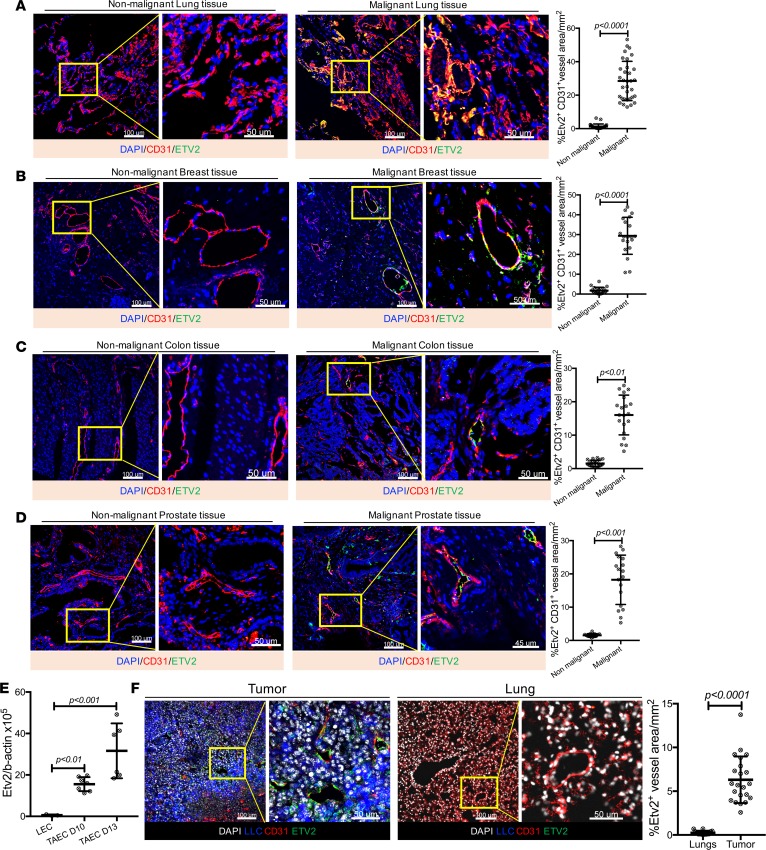
Figure 1. Etv2 is upregulated in tumor endothelial cells.
(A–D), Representative images for ETV2 (green) and CD31 (red) immunofluorescence of malignant and matched nonmalignant specimens from (A) lung, (B) breast, (C) colon, and (D) prostate cancer patients. DAPI (blue) is used to counterstain nuclei. Associated graphs show the quantification of ETV2-expressing CD31+ vessels in malignant versus nonmalignant tissues. Every cancer type had malignant and nonmalignant tissue specimen pairs collected from at least 3 patients; at least 3 sections from each patient were subjected to immunofluorescence. (E) qRT-PCR analysis of Etv2 expression in CD31+CD45– endothelial cells obtained from lung (LEC) and tumor (TAEC), 10 and 13 days after tumor cell transplantation (n = 3 LEC, 7 TAEC day 10, and 6 TAEC day 13). (F) Representative images for ETV2 (green) and CD31 (red) immunofluorescence of mouse tumor and lung sections, processed after 20 days of tumor transplantation. LLC-GFP cells (blue) and nuclei counterstained with DAPI (gray) are shown (n = 15 or more/group). Scale bars: 100 μm; 50 μm (higher-magnification images). Data are presented as mean with standard deviation for all measurements. Statistical significance was analyzed by either a 2-tailed Student’s t test (A–D and F) or 1-way ANOVA with Dunnett’s multiple-comparison test (E).

