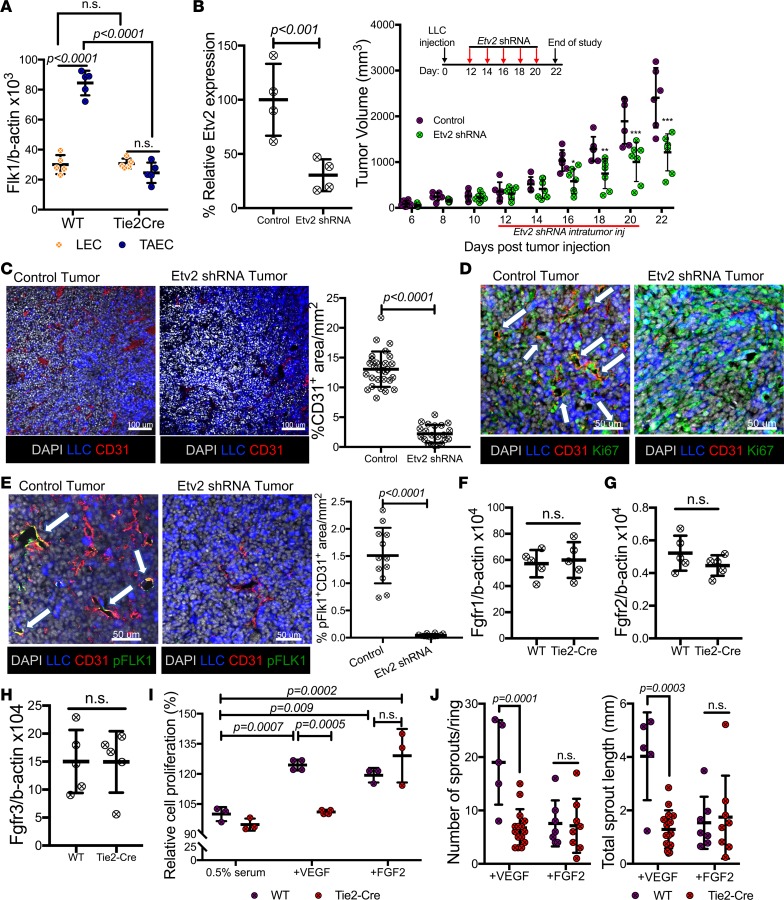
Figure 4. Etv2 regulates tumor endothelial cell–specific Flk1.
(A) qRT-PCR analysis of Flk1 expression in lung ECs (LECs) and tumor ECs (TAECs) obtained from littermate control (WT) and Tie2-Cre;Etv2-CKO mice on day 15 ptt (n = 5/group). (B) qRT-PCR analysis of Etv2 expression in CD31+CD45– ECs obtained from tumors of Gfp shRNA– (control) and Etv2 shRNA–treated mice on day 15 ptt. Data are shown as percentage relative expression of control shRNA group (n = 4/group). Tumor growth in Gfp shRNA– (control) and Etv2 shRNA–treated mice (n = 6 control, 7 Etv2 shRNA; *P < 0.05, **P < 0.01,***P < 0.001). (C–E) Representative images and quantification for (C) CD31 (red) (n = 25/group), (D) Ki67 (green), and (E) pFLK1 (Y951) (green) (n = 12/group) immunofluorescence of tumor sections. LLC-GFP cells (blue) and nuclei counterstained with DAPI (gray) are shown. White arrows indicate the expression of Ki67 (D) and pFLK1 (E) in tumor vessels. Scale bars: 100 μm (C); 50 μm (D and E). (F–H) Fgfr1, Fgfr2, and Fgfr3 expression in TAECs of littermate control (WT) and Tie2-Cre;Etv2-CKO mice on day 15 ptt (n = 5/group). (I) Lung ECs (LEC) of littermate control (WT) or Tie2-Cre;Etv2-CKO mice were sorted and subjected to a cell proliferation assay. Data are shown as a percentage of control (0.5% serum) (n = 4/group). (J) Aortas from the controls (WT) and Tie2-Cre;Etv2-CKO mice were subjected to an angiogenic sprouting assay, and the mean sprout number and length were measured 8 days later (n = 5 or more/group). Data are presented as mean with standard deviation for all measurements. Statistical significance was analyzed by either a 2-tailed Student’s t test (B, left, C, and E–H), or 2-way ANOVA with Sidak’s (A, I, and J) or 2-way repeated-measures ANOVA with Tukey’s (B, right) multiple-comparison test.

