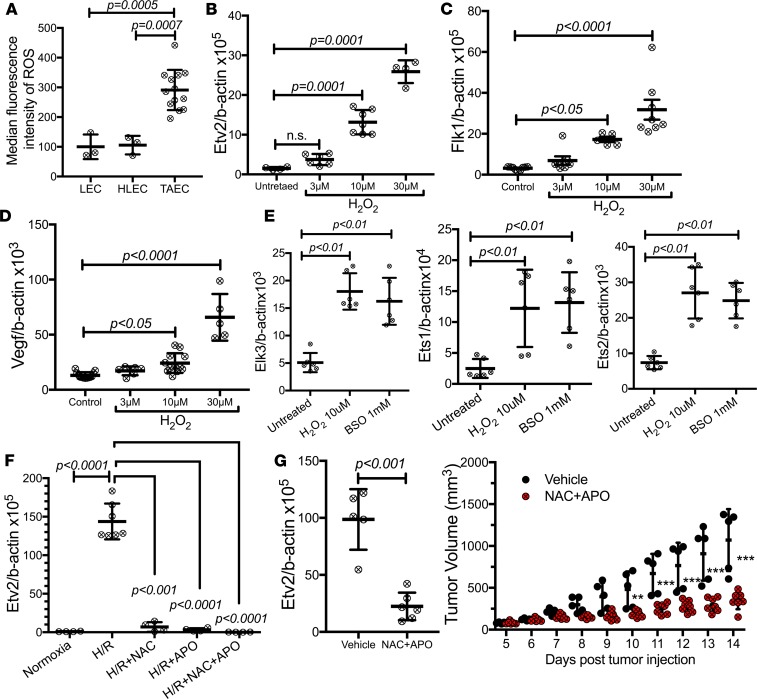
Figure 5. ROS trigger Etv2 expression.
(A) ROS levels in ECs obtained from lung (LEC), hind limb tissue (HLEC), or tumor (TAEC) (n = 3 or more/group). (B–E) qRT-PCR analysis of expression of (B) Etv2, (C) Flk1, (D) Vegf, and (E) Ets factors Elk3, Ets1, and Ets2 in H2O2-treated yolk sac–derived endothelial (YSE) cells (n = 4 or more/group). (F) Etv2 expression in YSE cells underwent with 24-hour hypoxia (<1% oxygen), followed by 24-hour normoxia (H/R) with/without ROS scavengers N-Acetyl cysteine (NAC; 5 mM) and apocynin (APO; 100 mM) (n = 4 or more/group). (G) Etv2 expression in TAECs isolated from untreated and NAC+APO-treated mice on day 14 ptt. Tumor growth in untreated and NAC+APO-treated mice. Mice were treated with daily i.p. injections of vehicle or a combination of NAC (200 mg/kg) and APO (50 mg/kg) for 10 days, from day 4 to day 13 ptt (n = 5 vehicle, 7 NAC+APO) (**P < 0.01, ***P < 0.001). Data are presented as mean with standard deviation for all measurements. Statistical significance was analyzed by either a 2-tailed Student’s t test (G, left), 1-way ANOVA with Dunnett’s (B–F) or Bonferroni’s multiple-comparison test (A), or 2-way repeated-measures ANOVA with Sidak’s multiple comparison test (G, right).

