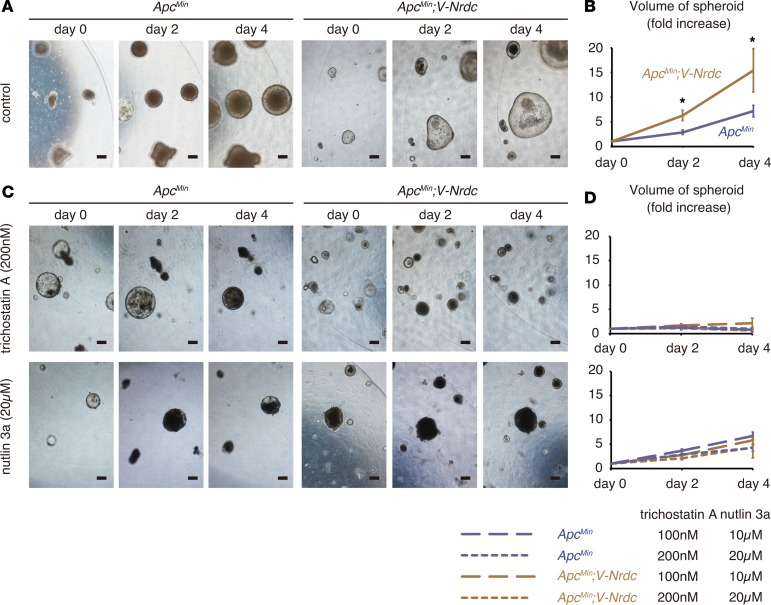
Figure 9. NRDC regulates viability of tumor spheroids.
(A) Tumor spheroids were generated from intestinal tumors of ApcMin and ApcMin; Villin-Nrdc mice, and serially observed. (B) Growth curves of tumor spheroids. Data represent means ± standard error (SE) of 20 independent experiments (fold increase). (C) Tumor spheroids treated with trichostatin A (upper; 0, 100, and 200 nM final concentration) and nutlin 3a (lower; 0, 10, and 20 μM final concentration). (D) Growth curves of tumor spheroids treated with trichostatin A and nutlin 3a. Data represent means ± standard error (SE) of 20 independent experiments (fold increase). Scale bars: 200 μm. *P < 0.05 by unpaired 2-tailed Student’s t test.

