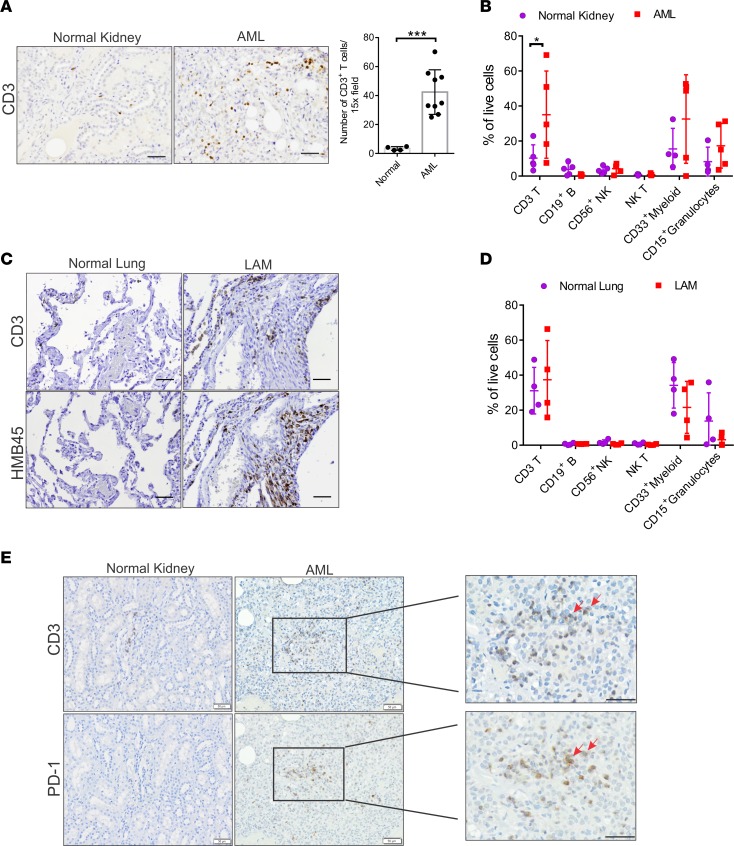
Figure 1. Increased T cell infiltration and PD-1+ T cells in angiomyolipomas (AML) and lymphangioleiomyomatosis (LAM).
(A) Left, representative CD3 IHC in AML (n = 9) and normal kidney (n = 4). Scale bar: 50 μm. Right, quantification of CD3+ T cells in AML vs. normal kidney. Statistical significance was determined by Mann-Whitney’s U test. ***P < 0.001. (B) Multiparametric flow cytometry data of AML (n = 5) and normal kidney (n = 4) indicating the frequency (%) of CD3 T cells, CD19+ B cells, CD56+ NK cells, NKT cells, CD33+ myeloid cells, and CD15+ granulocytes. Data are presented as mean ± SD. Statistical significance determined by multiple 2-tailed t test followed by Holm-Sidak post-test for multiple comparisons. *P < 0.05. (C) Representative CD3 and HMB45 IHC in LAM (n = 10) and normal lung (n = 3). Scale bar: 50 μm. (D) Multicolor flow cytometry data for LAM (n = 4) and normal lung (n = 4) indicating the frequency (%) of CD3 T cells, CD19+ B cells, CD56+ NK cells, NKT cells, CD33+ myeloid cells, and CD15+ granulocytes. Data for bar graphs were calculated using multiple 2-tailed t test followed by Holm-Sidak post-test for multiple comparisons. (E) Representative IHC for CD3 and PD-1 in serial sections of AML (n = 10) and normal kidney (n = 4). Red arrows indicate PD-1+ T cells. Scale bar: 50 μm and 25 μm (inset).

