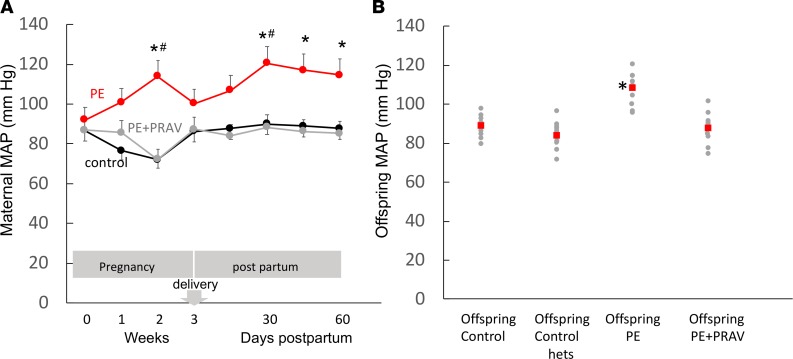
Figure 2. Mean arterial blood pressure during and after preeclampsia.
(A) Mean arterial pressure (MAP) measured prior to mating, during pregnancy (first, second, and third week) and during postpartum (15, 30, 45 and 60 days) in PE mice, control mice, and PE mice treated with pravastatin (PE+PRAV). Comparisons between groups were performed by 1-way ANOVA with Bonferroni’s post hoc test between groups. *P < 0.05, different from control mating at same time; #P < 0.05, different from previous time point. Six to eight mice were studied in each experimental group. (B) MAP in the offspring of control mice, PE mice, and PE+PRAV mice. MAP values measured in heterozygote C1q+/– offspring from mice that did not develop PE (offspring control hets) are also shown. Red squares represent the mean. *P < 0.05, different from control. Ten to twelve mice (2 offspring/mother) were studied in each experimental group.

