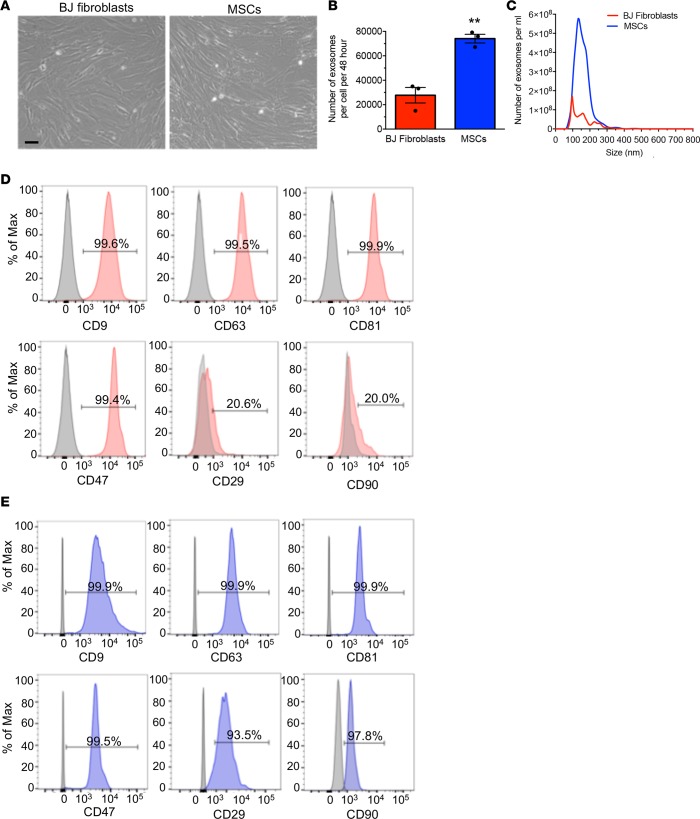
Figure 2. Exosome production by MSCs.
(A) Representative bright-field images of BJ fibroblasts and MSCs. Scale bar: 100 μm. (B) Comparison of the number of exosomes quantified by NanoSight, produced by the same number of BJ fibroblasts and MSCs, and collected from the conditioned media over a period of 48 hours (n = 3 independent collections). (C) Particle size distribution analysis of BJ fibroblast exosomes and MSC exosomes by NanoSight. (D and E) Representative histogram of flow cytometry analysis of exosomal markers (CD9, CD63, CD81), CD47, and mesenchymal markers (CD29, CD90) on BJ fibroblasts (red, D) exosomes and MSC exosomes (blue, E). Numbers represent the percentage of positive beads (gray, isotype control). The data are presented as the mean ± SEM. Unpaired 2-tailed t test was used to determine statistical significance. **P < 0.01. See Supplemental Source Data 1 and 2.

