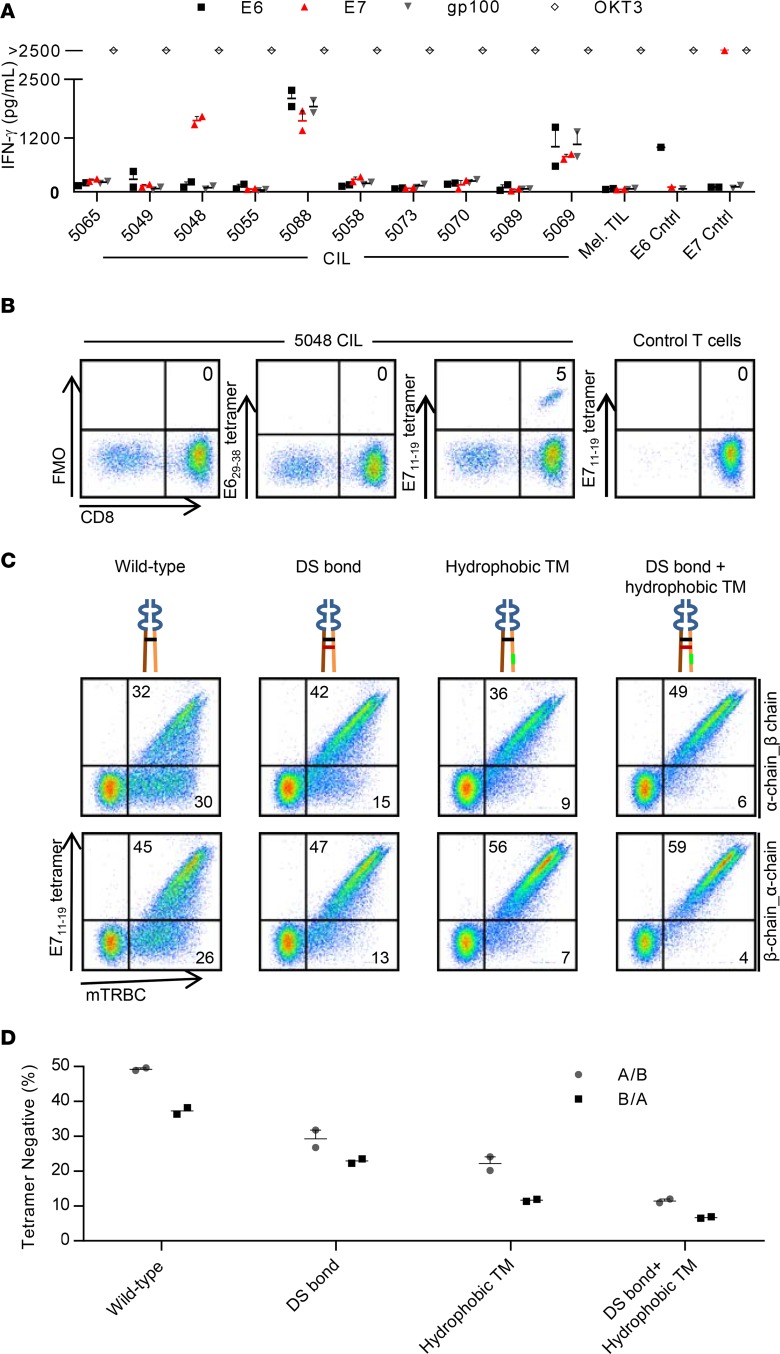
Figure 1. Identification and optimized expression of a TCR that targets HPV-16 E7.
(A) IFN-γ production assay testing CILs from 10 patients for recognition of HPV-16 E6 or E7. CILs from each patient were cocultured with autologous dendritic cells loaded with peptide pools spanning the indicated antigen. gp100, also known as melanocyte protein PMEL, is the negative control protein. OKT3 is a positive control of T cells stimulated with plate-bound anti-CD3 antibody. Mel TILs are a negative control of TILs from a melanoma patient. E6 Cntrl and E7 Cntrl are positive controls of T cells genetically engineered to express an E6- or E7-targeting TCR, respectively. The concentration of IFN-γ in supernatants after overnight coculture is displayed. (B) Flow cytometry analysis of 5048 CILs binding to E711–19-HLA-A*02:01 tetramers. E629–38 tetramer is a negative control tetramer. Control T cells are activated, third-party T cells. Dot plots are gated on live lymphocytes. The tetramers were PE labeled. The anti-CD8 antibody was PE-Cy7 labeled. FMO, fluorescence minus one. (C) Flow cytometry analysis of T cells transduced to express the E7 TCR. The schematic for each construct is shown above each dot plot. Orange and brown indicate α and β chain constant regions, respectively. The wild-type interchain disulfide bond is black. The introduced disulfide bond is red. Hydrophobic substitutions to the α chain transmembrane region are green. Variable regions are blue. The α and β chain gene order in the vector insert is indicated to the right of each row. Dot plots are gated on live lymphocytes. Quadrant frequencies are indicated. DS, disulfide; TM, transmembrane; mTRBC, mouse TCR β constant region. The tetramer is APC labeled. The anti-mTRBC antibody is PE labeled. (D) Data from the experiment in C are graphed to display the frequency of transduced T cells (mouse TCR β chain–positive) that did not bind E711–19-HLA-A*02:01 tetramers. Error bars represent the SEM for technical replicates. For C and D, the results are representative of 2 independent experiments.

