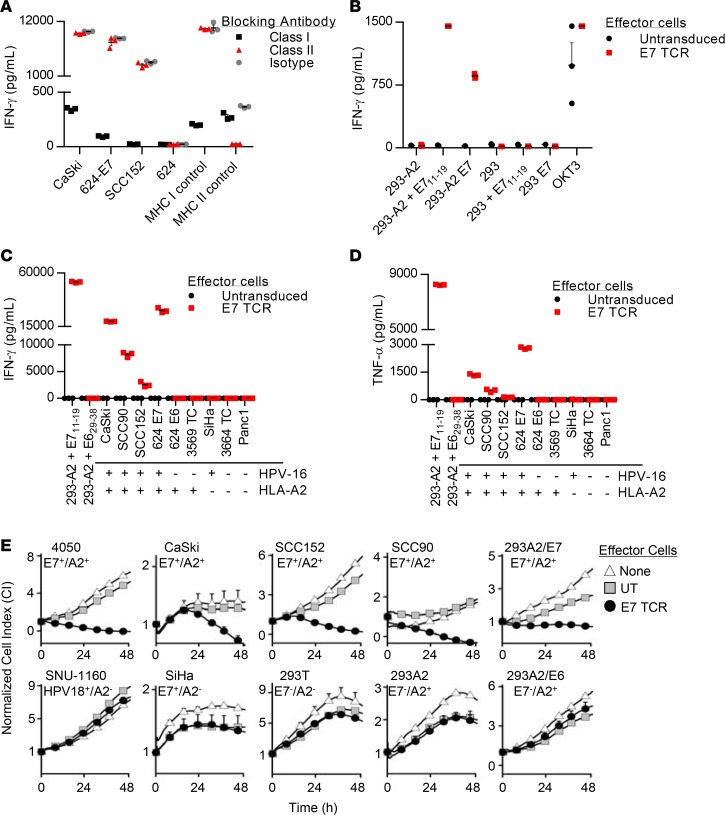
Figure 2. Characterization of the in vitro function of E7 TCR T cells.
(A) MHC blocking assay in which the effector cells are E7 TCR T cells and the target cells are as indicated on the x axis. Blocking antibodies against MHC class I or II were added. In the class I control, DMF5 TCR T cells (57) were cocultured with 624 melanoma cells. In the class II control, MAGE A3 TCR T cells (58) were cocultured with 526-CIITA cells. (B) Coculture assay to test for confirmation of the target antigen and restriction element for the E7 TCR. Target cells are 293 cells with or without stable expression of HLA-A*02:01 (293 or 293-A2). They were pulsed with E711–19 peptide (E711–19) or transfected with a plasmid encoding full-length E7 (E7) as indicated on the x axis. OKT3 is a positive control with T cell stimulation by plate-bound anti-CD3 antibody. (C and D) Tumor cell line recognition assays showing the concentration of (C) IFN-γ and (D) TNF-α in supernatants following overnight coculture. 293-A2 cells were pulsed with E711–19 or E629–38 peptide as indicated by x axis labels. The other cell lines did not have peptide added. The HPV-16 and HLA-A*02:01 expression of the target cell lines is indicated below each x axis label. (E) E7 TCR T cell–mediated cytolysis of tumor cell lines, as determined by an ACEA xCELLigence Real Time Cell Analyzer. The target cell line name and the expression of HPV-16 E7 and HLA-A*02:01 are indicated above each graph. The effector-to-target (E/T) ratio is 1:5. The values plotted are the means of 2 technical replicates, and error bars represent the SEM. The data displayed are representative of 2 independent experiments. UT, untransduced T cells; E7 TCR, E7 TCR–transduced T cells.

