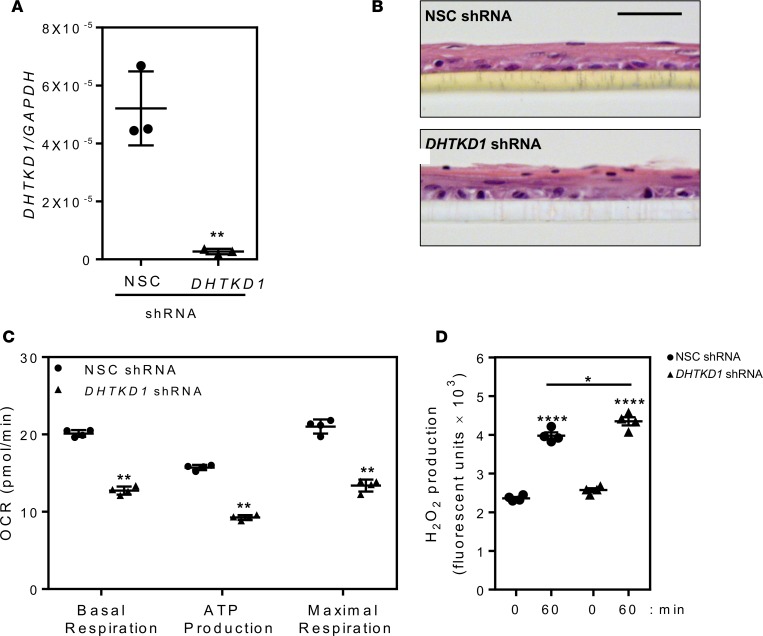
Figure 6. DHTKD1 deficiency impairs mitochondrial function in esophageal epithelial cells.
Quantitative PCR showing efficiency of gene silencing by dehydrogenase E1 and transketolase domain–containing 1–specific (DHTKD1-specific ) shRNA compared with a nonsilencing control (NSC) shRNA in esophageal epithelial cell lines (EPC2) (A). Assessment of epithelial differentiation by H&E staining of EPC2 cells expressing NSC or DHTKD1 shRNA grown at the air-liquid interface (ALI) (B). Scale bar: 50 μM. Measurement of mitochondrial function (oxygen consumption rate [OCR]: basal respiration, ATP production, and maximal respiration) (C) and H2O2 production (D) in EPC2 cells expressing NSC (black circles) or DHTKD1 shRNA (black triangles). Data in A are a representative of 3 independent experiments performed in triplicates, images in B are representative image from 3 independent experiments performed in triplicates, and data in C are from 4 cycles per measurement and at least 6 wells for each cell line. Data in D are representative of 3 independent experiments performed in quadruplicate. Data in A and D are presented as the mean ± SEM compared with NSC or time 0 in D, and data in C are presented as mean ± SD. Statistical analysis done via 1-way ANOVA (and nonparametric) with Holm-Sidak multiple comparison test (A); unpaired t tests with Gaussian distribution and 95% confidence interval (C); 1-way ANOVA (and nonparametric) with Tukey multiple comparisons test (D). *P < 0.05; **P < 0.01; and ****P < 1 × 10⁻⁴.

