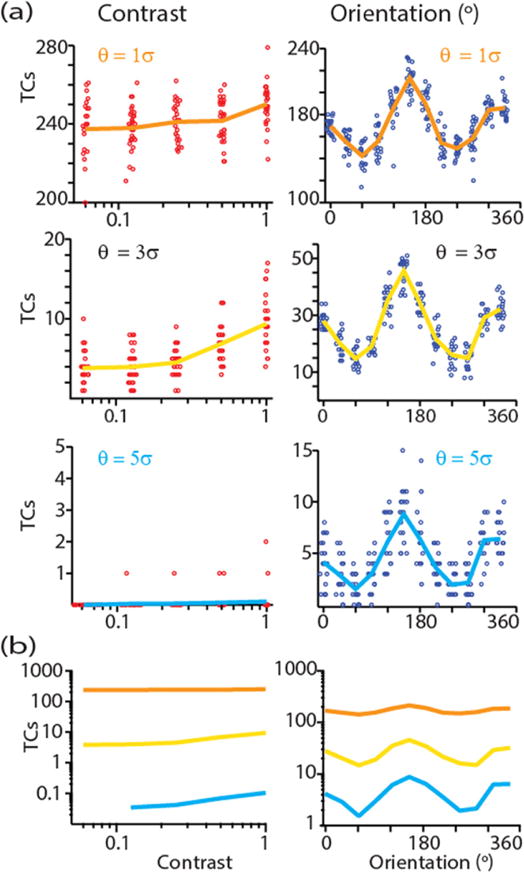
Figure 7.

A single V1 channel example of how contrast and orientation tuning change with threshold. (a) Each data point represents the number of threshold crossings from one representative electrode recorded during a single trial. For visualization purposes, the data points are jittered with respect to orientation angle or contrast, respectively. To highlight the tuning, the mean threshold crossings to each orientation are connected and plotted using the color scheme in figure 2 (orange = 1σ, yellow = 3σ, light blue = 5σ). These curves are overlaid on the same plot in (b). Note the log scale on the TC axis.
