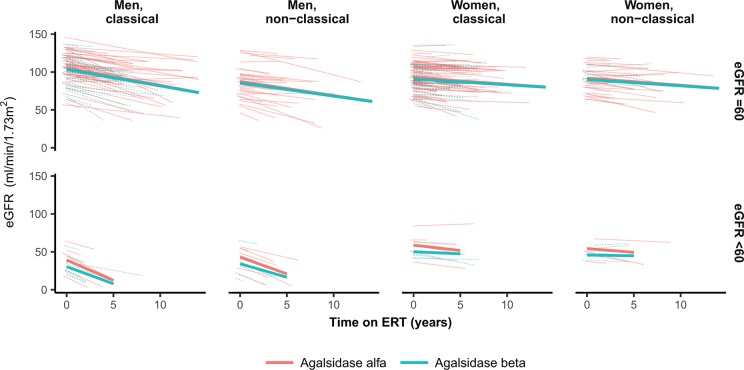
Figure 2.
Estimated glomerular filtration rate (eGFR) vs time on enzyme replacement therapy (ERT). Linear mixed model of eGFR adjusted for sex and phenotype, stratified for baseline eGFR <60 and ≥60 mL/min/1.73 m2. The larger lines represent the predicted values at group level, the smaller lines represent the predicted values at individual patient level.

