
Fig. 1. Cytotoxicity-related transcripts are enriched in the CD4-TEMRA sub-set.
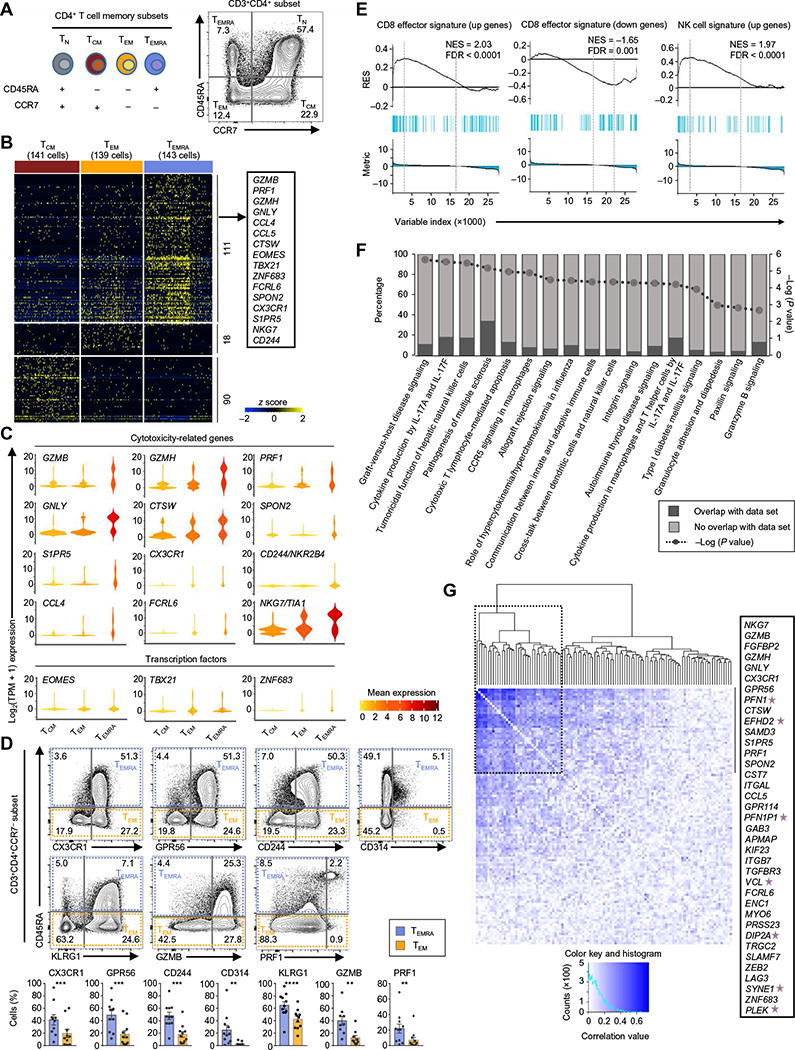
(A) Schematic representation of the CD4+ T cell subsets and their surface markers used for the study. (B) Single-cell RNA-seq analysis showing row-wise z scores of normalized TPM (transcripts per million) counts of cells in each subset (indicated at the top) for each differentially expressed transcript (rows) obtained by pairwise comparison of TEMRA versus TEM, TEMRA versus TCM, and TEM versus TCM [single-cell differential expression (SCDE) and model-based analysis of single-cell transcriptomics (MAST) analysis, Benjamini-Hochberg adjusted P < 0.05 and ≥2-fold change). (C) Violin plots show the single-cell expression pattern of the indicated TEMRA-enriched transcripts (cytotoxicity-related and TFs) in the indicated subsets. The shapes represent the distribution of cells based on their log2(TPM + 1) expression values (y axis). The color scale represents the mean expression. (D) The contour plots show the surface expression of CD45RA, CX3CR1, GPR56, CD244, CD314, and KLRG1 and intracellular expression of GZMB and PRF1 in singlet-gated CD3+CD4+CCR7− cells. The numbers denote the percentage of cells in each quadrant. Bar graphs beneath show the average percentages. Error bars are mean ± SEM from 9 (GZMB), 10 (CX3CR1), and 11 (other indicated proteins) donors. **P < 0.001, ***P < 0.0005, and ****P < 0.0001 from Student’s paired two-tailed t test. (E) GSEA enrichment plots for the indicated gene sets in the transcriptome of TEMRA versus TEM and TCM (see Supplementary Materials and Methods). The top portion of the plot shows the running enrichment score (RES) for the gene set as the analysis walks down the ranked list of genes and reflects the degree to which the gene set is overrepresented at the top or bottom of the ranked list of genes. The middle portion of the plot shows where the members of the gene set (indicated as blue lines) appear in the ranked list of genes. The bottom portion of the plot shows the value of the ranking metric. NES, normalized enrichment score; FDR, false discovery rate. (F) IPA of canonical pathways enriched in the TEMRA subset; P values calculated by Fisher exact test (see Supplementary Materials and Methods). (G) Spearman correlation plot showing the coexpression of the 111 TEMRA-enriched transcripts. Dashed black box shows a cluster of transcripts showing high correlation; the list of these transcripts is shown in the text box on the right, and stars highlight the genes not previously reported to have cytotoxic function.