
Fig. 3. CD4-TEMRA cells are heterogeneous across donors.
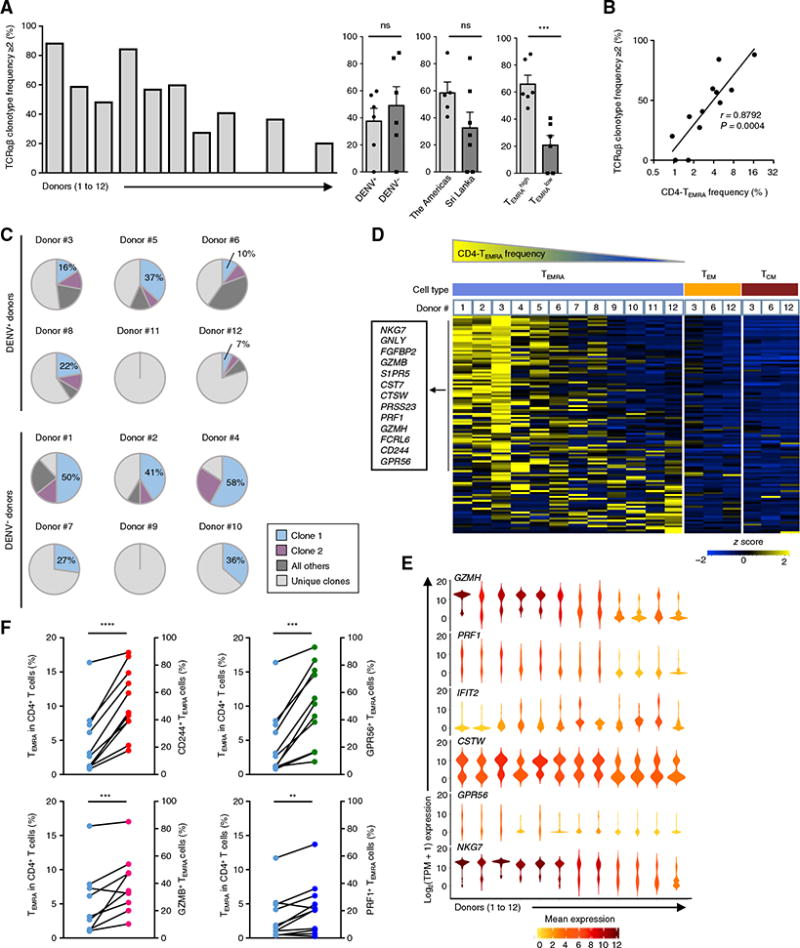
(A) Bar graph shows the percentage of clonally expanded TEMRA cells (cells having a unique TCRα and TCRβ chain clonotype with frequency ≥2) across 12 donors (left) and between donors classified on the basis of their status of previous DENV infection (DENV+ and DENV−), geographical location [Sri Lanka, Nicaragua, and San Diego (the Americas)], and CD4-TEMRA proportion (TEMRAhigh, donors #1 to #6; TEMRAlow, donors #7 to #12). Each dot represents data from a single donor. Error bars are mean ± SEM. ***P = 0.001 from Student’s unpaired two-tailed t test; ns, not significant. (B) Correlation between the proportions of the CD4-TEMRA subset in CD4+ T cells and clonally expanded TEMRA cells (cells having a unique TCRα and TCRβ chain clonotype with frequency ≥2). r, Spearman correlation coefficient; P, by Student’s two-tailed paired t test. (C) Pie charts show the percentage of TEMRA cells with the first (clone 1) and second (clone 2) most frequent unique TCRα and TCTβ chain clonotype, as well as other clonally expanded cells (all others) and the rest of the TCRα and TCRβ chain clonotypes present in only one cell (unique clones). (D) Single-cell RNA-seq analysis of TEMRA (blue), TEM (yellow), and TCM (brown) cells shows the row-wise normalized mean TPM counts of 111 TEMRA-enriched transcripts [from Fig. 1 (B and C)] (rows) for each donor (column). The panel above the heat map identifies the cell type and donor number (#1 to #12, ordered on the basis of the frequency of the CD4-TEMRA subset). (E) Violin plots show the single-cell expression pattern of the indicated transcripts in the TEMRA subset across the 12 donors. The shapes represent the distribution of cells based on their log2(TPM + 1) expression values (y axis). The color scale represents the mean expression. (F) Matched data from the same donors showing the proportion of TEMRA cells in the CD4+ T cell subset (blue) and the proportion of CD244+ (red), GPR56+ (green), GZMB+ (pink), and PRF1+ (dark blue) TEMRA cells from 9 to 11 donors. Each dot represents a donor. **P < 0.001, ***P < 0.0005, and ****P < 0.0001 from Student’s paired two-tailed t test.