
Fig. 4. Four distinct subsets of CD4-CTLs revealed by single-cell RNA-seq analysis.
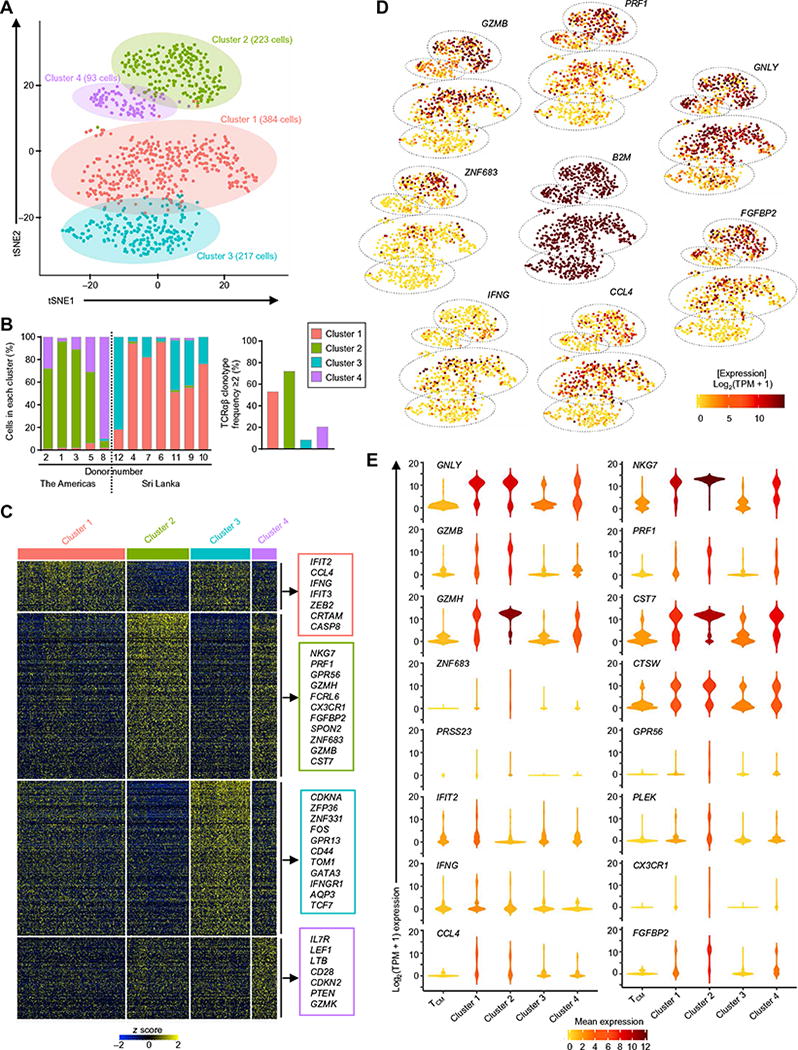
(A) t-Distributed stochastic neighbor embedding (tSNE) two-dimensional (2D) plot of single-cell RNA-seq data (n = 917 cells, based on 1000 most variable transcripts) shows four distinct clusters of cells in the TEMRA subset. (B) Bar graph shows the distribution of cells across four clusters in each indicated donor (donor numbers match those in table S1) classified on the basis of geographical location (the Americas and Sri Lanka, left) and the percentage of clonally expanded cells (cells having a unique TCRα and TCRβ chain clonotype with frequency ≥2) in each cluster (right). (C) Single-cell RNA-seq analysis shows row-wise z scores of mean-normalized TPM counts of cells in each cluster for each differentially expressed transcripts (rows) obtained by pairwise comparison of each cluster versus the rest of the clusters (Seurat analysis, Benjamini-Hochberg adjusted P < 0.05) for the four clusters. (D) tSNE 2D plots of single-cell RNA-seq data show the expression of the indicated differentially expressed transcripts (SCDE and MAST analysis, Benjamini-Hochberg adjusted P < 0.05 and ≥2-fold change). B2M is shown as a control housekeeping gene. (E) Violin plots show the single-cell expression pattern of the indicated differentially expressed transcripts across four TEMRA clusters along with TCM. The shapes represent the distribution of cells based on their log2(TPM + 1) expression values (y axis). The color scale represents the mean expression.