Figure 1.
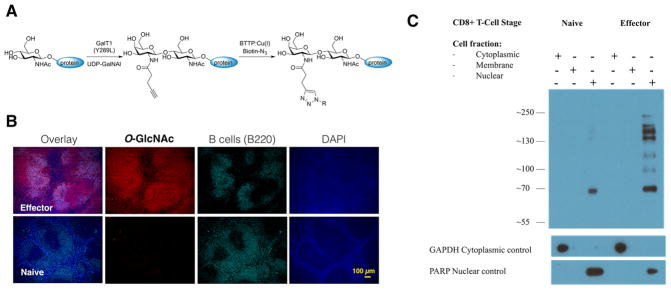
Elevated O-GlcNAc levels for in vivo activated T cells. (A) Schematic representation of a two-step chemoenzymatic O-GlcNAc detection. Transferring of alkyne bearing galactose from UDP-GalNAl donor using GalT1(Y289L), followed by CuAAC using the BTTP-Cu(I) catalyst and an accelerated biotin-azide probe.29–31 (B) Chemoenzymatic staining of O-GlcNAc in 5 μm spleen FFPE tissue sections from naïve or 7-dpi with LM mice. Red = chemoenzymatic O-GlcNAc detection, cyan = B220 antibody B-cell detection, blue = DAPI nuclear stain. Scale bar = 100 μm. (C) Cell fractions from CD8+ T cells isolated from C57BL/6 naïve or 7-dpi with LM mice were probed for O-GlcNAc expression using antibody RL2. Glyceraldehyde 3-phosphate dehydrogenase (GAPDH) and Poly (ADP-ribose) polymerase (PARP) were used as loading controls for the cytoplasmic and nuclear fractions respectively.

